Insights
The Insights area helps you understand how legacy code and database structures relate to each other before you make decomposition decisions. It combines schema exploration, graph views, conflict analysis, and usage patterns in one workspace. Use these pages to validate assumptions and gather evidence for bounded context design.
Prerequisite
To use the Insights features, upload a valid schema .json file first. Create this file either by running the DB-Crawler command-line utility against the database or by extracting the SQL DDL scripts from the database.
Legacy Database
The Legacy Database feature provides a centralized interface for exploring the structure and contents of legacy database systems. This tab provides different comprehensive views of client's database to fully understand their database structure and schema.
Table Overview
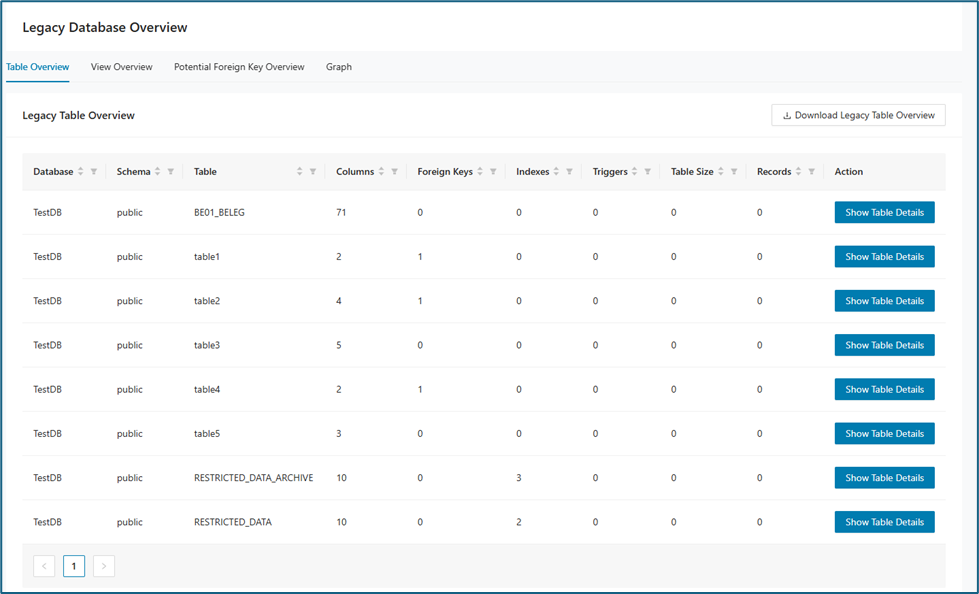
The Table Overview tab provides a clear summary of all tables within the selected database schema, supporting quick assessment and navigation.
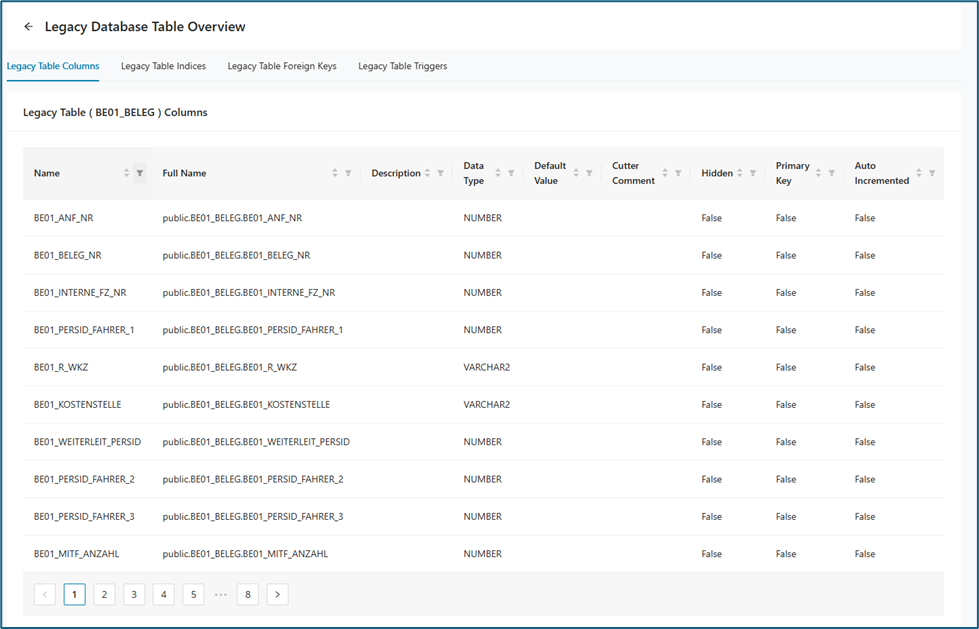
When Show Table Details is clicked, the system displays a detailed breakdown of the selected table’s columns, indexes, foreign keys, and triggers. Each category is presented in its own table, allowing users to easily review and understand specific aspects of the table’s structure.
View Overview
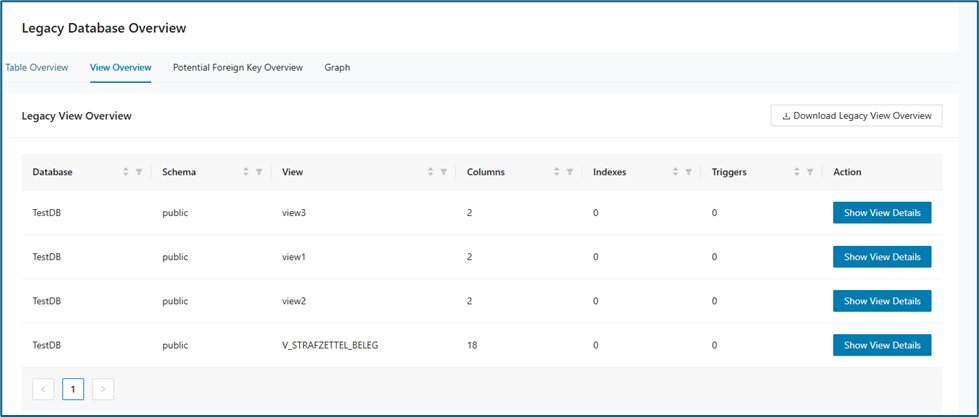
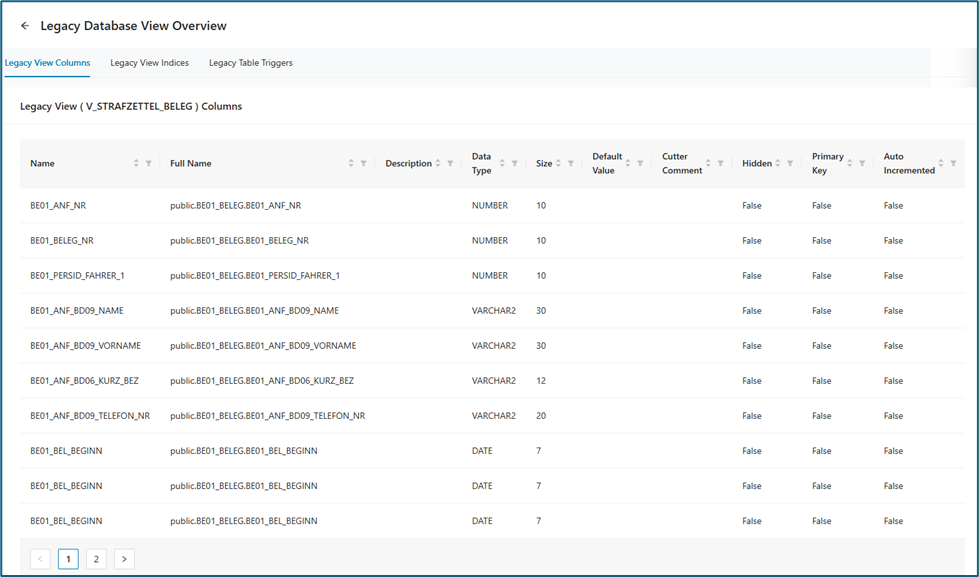
The Legacy View Overview table lists all the different views and the tables they are tied to. It also lists, for each view, the number of columns, indexes, and triggers associated with that view.
When Show Table Details is clicked, the page displays the characteristics of the selected view, such as column names, data types, sizes, and other relevant information. Additional details are available on the Legacy View Indices and Legacy Table Triggers tabs, if such information exists.
Potential Foreign Key overview
Graph
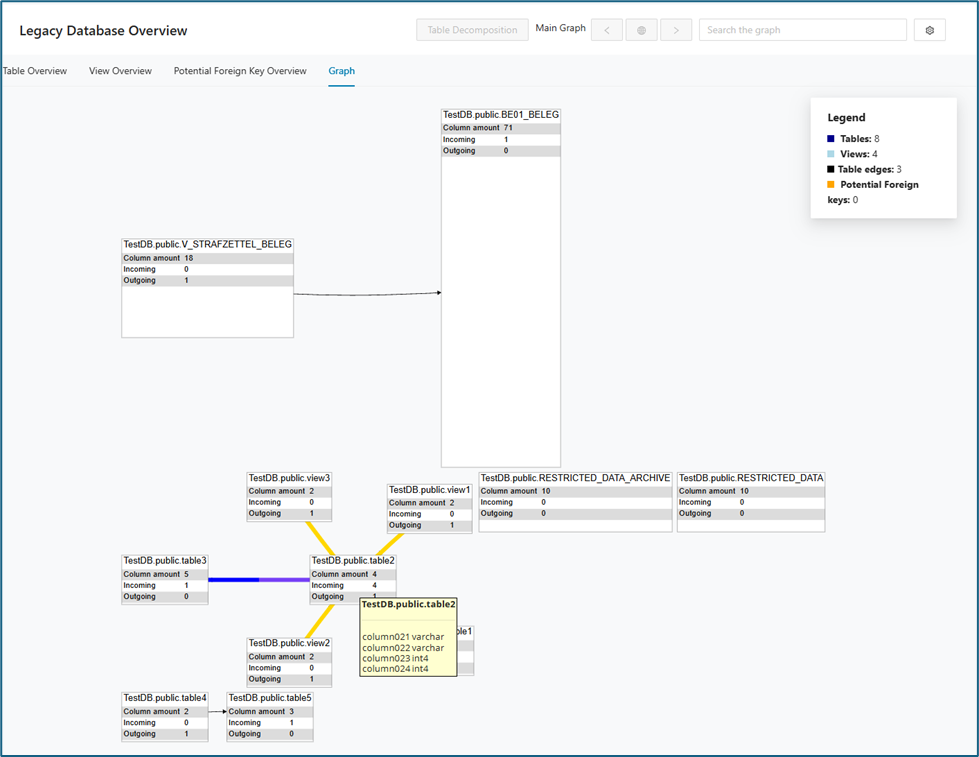
This graph provides a visual representation of the structure and relationships within your legacy database, as summarized in the Table Overview. It helps you understand how tables and views interact and highlights key relational features or gaps in the schema. The legend in the upper left corner of the Legacy Database graph displays the object count for the:
-
Number of Potential Foreign keys
-
Number of Tables
-
Number of Views
-
Number of Foreign keys (= edges)
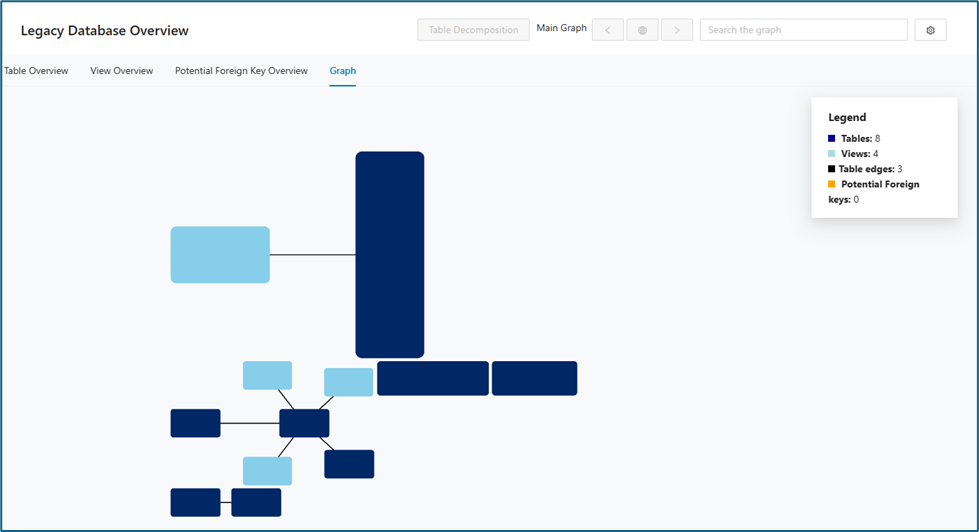
As you zoom in on the graph, additional details become available. The graph displays full names and shows how data flows into and out of each table and view.
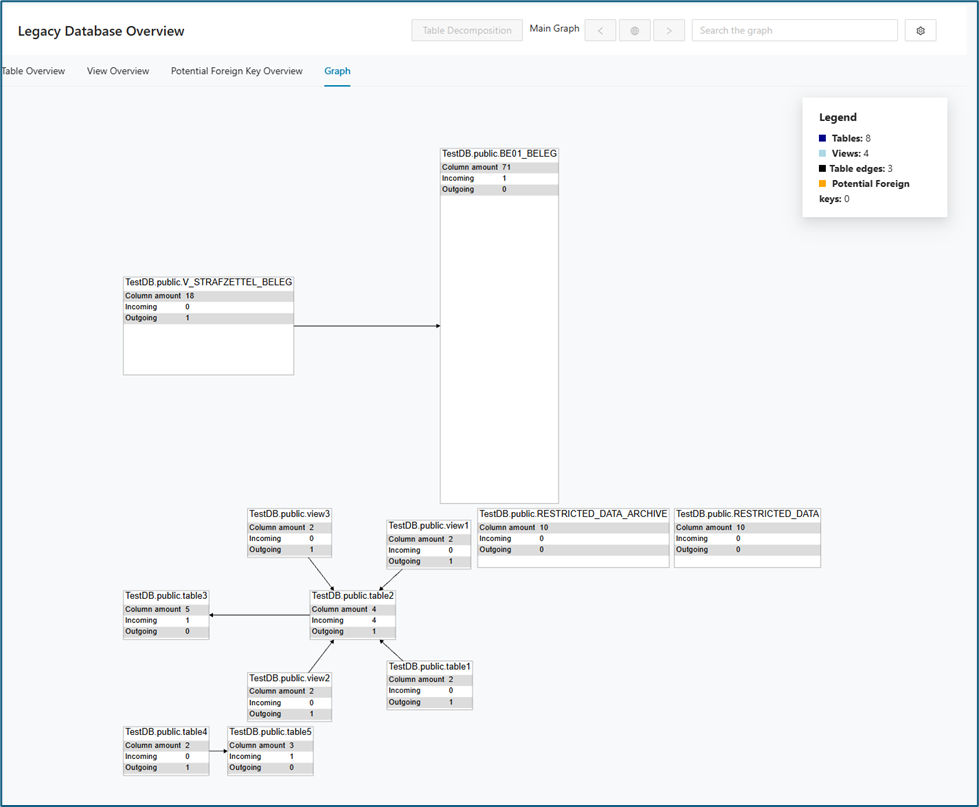
When you zoom in further, each table and view is shown with its full name, total number of columns, and the direction of incoming and outgoing links. For tables, all column names and data types are displayed, making it easy to review the schema details and relationships.
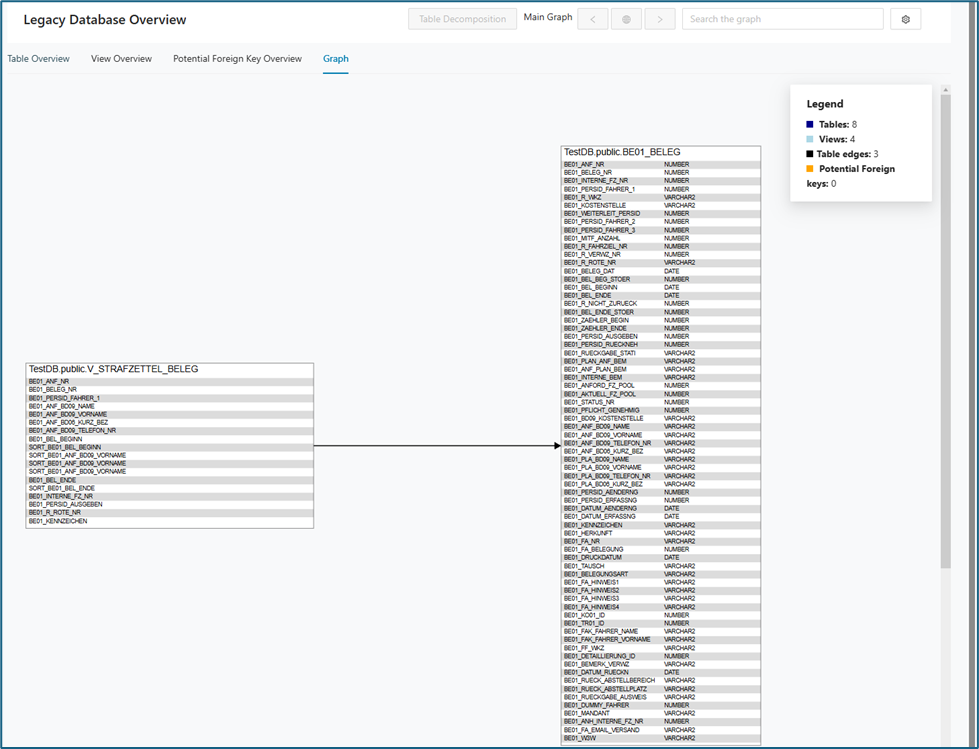
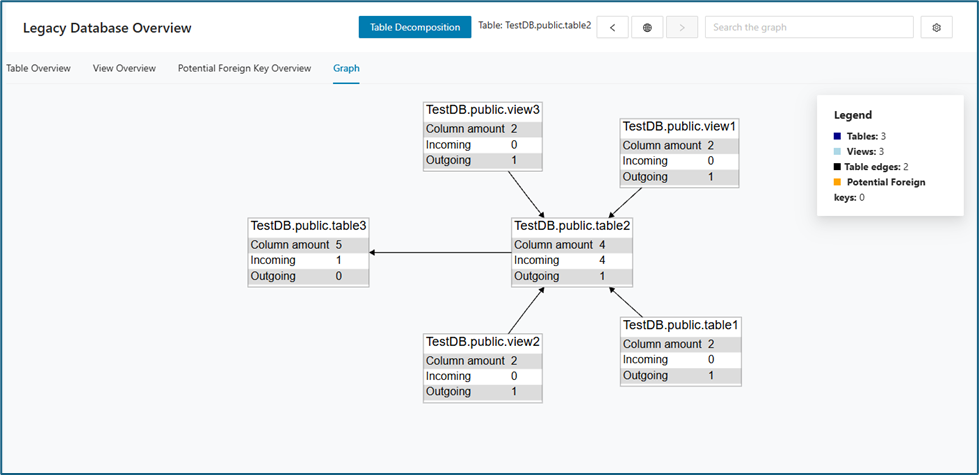
You can also click a specific table to focus the graph on that table and its related views.
Graph options
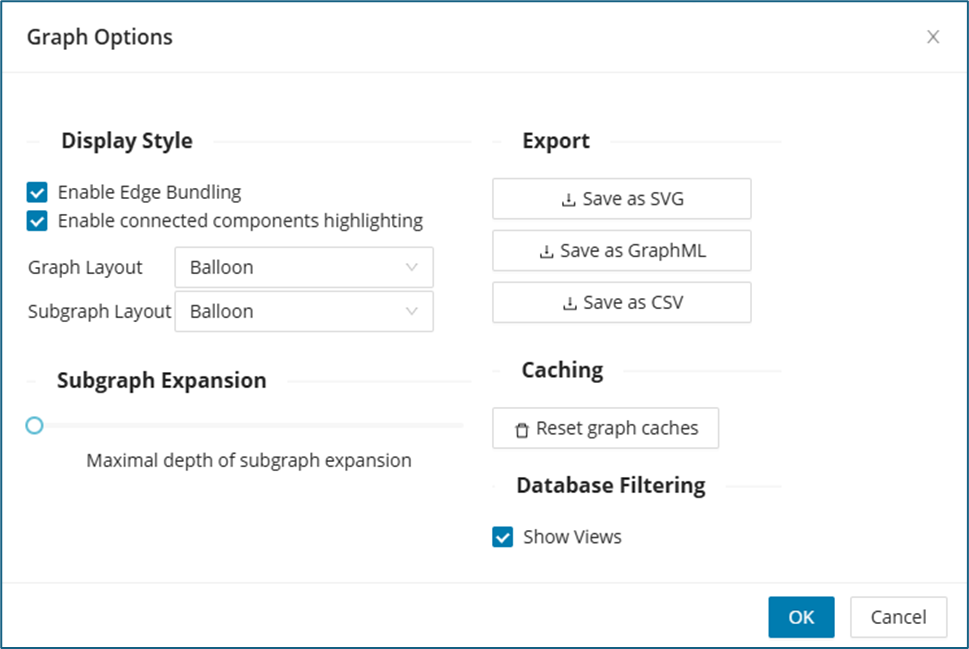
Users have flexible options to tailor the Graph/Subgraph Layout to their needs. Click the settings icon located in the top right to open the "Graph Options" window. Users can switch between different visualization styles, such as Balloon, Hierarchical, Organic, or Radial layouts, to best highlight the relationships among tables and views. The Subgraph Expansion slider allows you to adjust how many layers of related objects are displayed, controlling the depth of the graph for focused analysis or a more comprehensive view. Additionally, filtering options make it easy to customize what you see—for instance, you can hide views by unchecking the Show Views option, so only tables are displayed. These features help users explore the database structure in the way that best fits their specific analysis or troubleshooting task.
The Export feature makes it easy for users to download the current graph view in different formats. Users can choose to export the visualization as an SVG for high-quality images, as GraphML for further analysis in other graph tools, or as a CSV to capture detailed tabular data about the tables, views, and their relationships.
Query Paths
The Query Paths page shows the relation between source code and tables. Bounded contexts are represented by a diamond shape. Each context has its own color. Modules are represented by circles. If they are related to only one context, they take the color of the context. Tables are represented by gray squares.
The Query Paths graph shows the relationships between bounded contexts, modules, and tables. With this graph, you can see which modules access which tables, or view the same relationships from the table perspective. The graph supports zooming, filtering, and navigation to subgraphs.
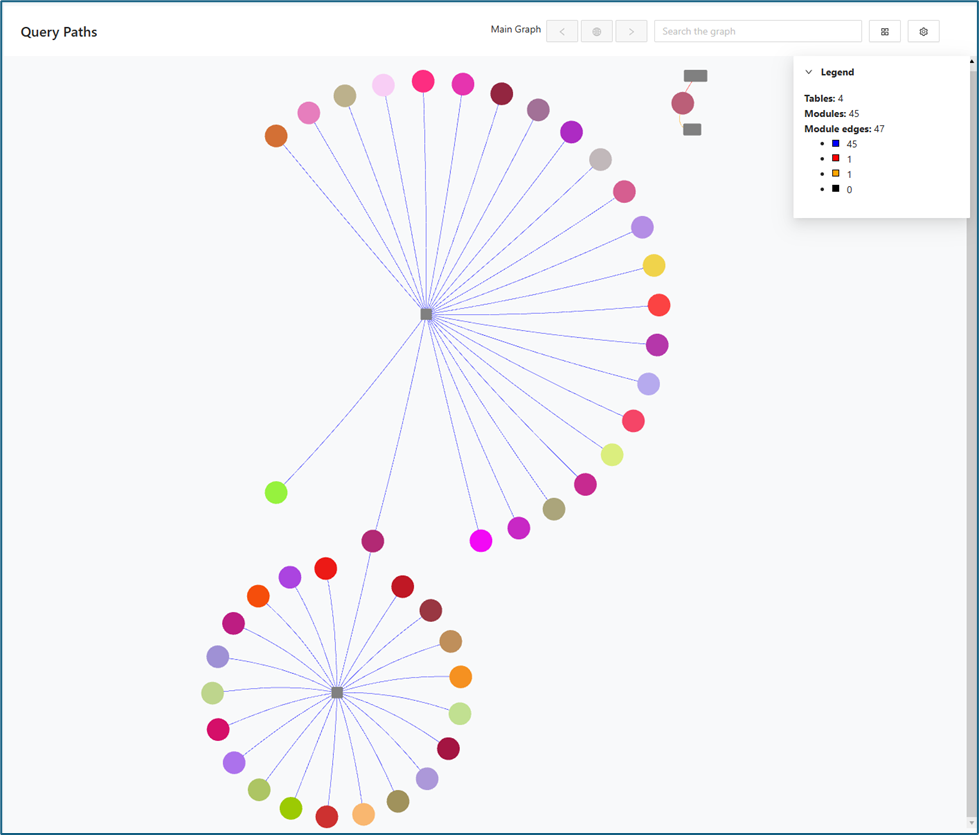
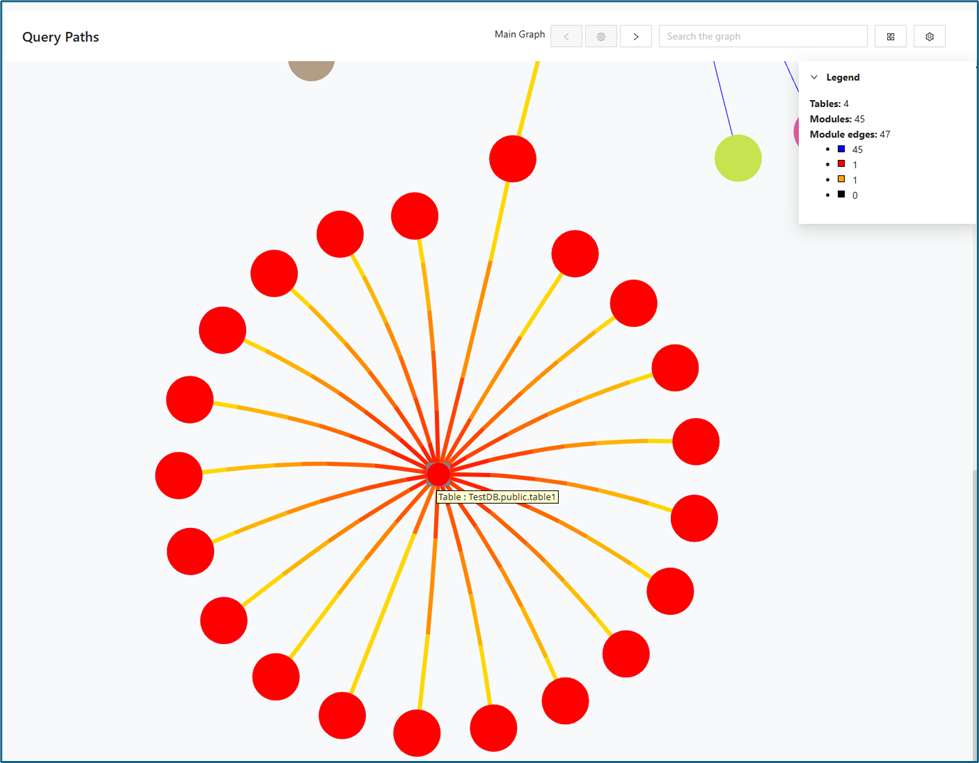
When the user hovers the mouse over a particular table in the diagram, all the connections between that table and associated modules are visually highlighted to indicate their relationships.
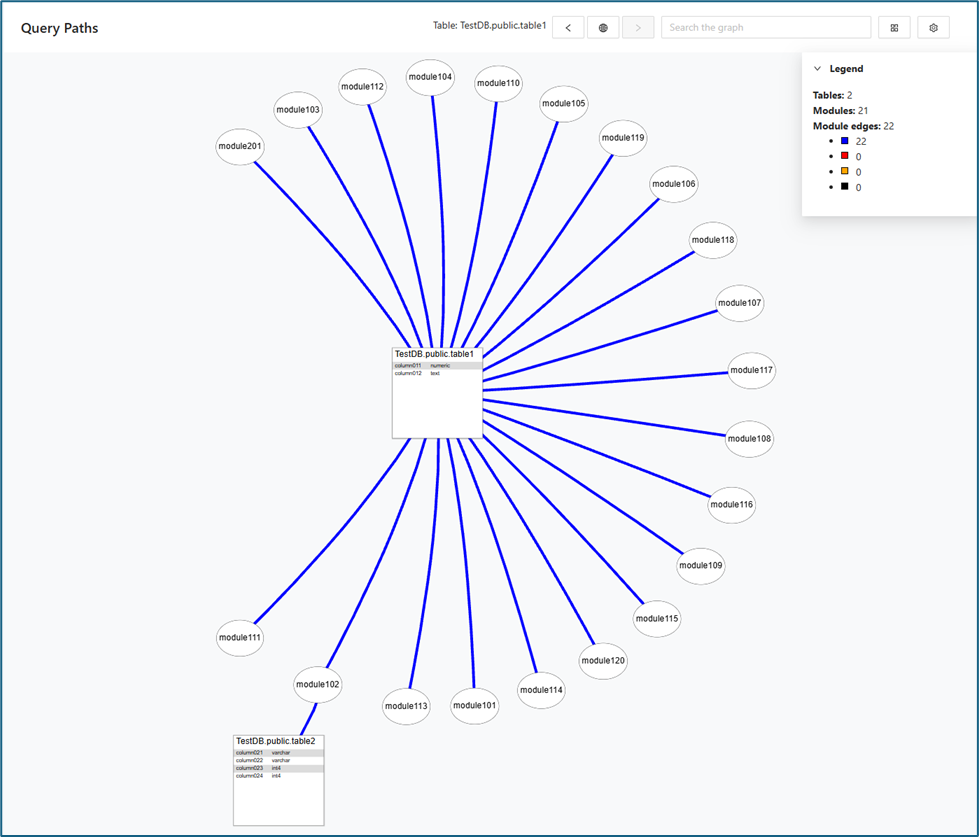
When a user clicks on a specific table, the graph will display the names and details of both the selected table and all related modules.
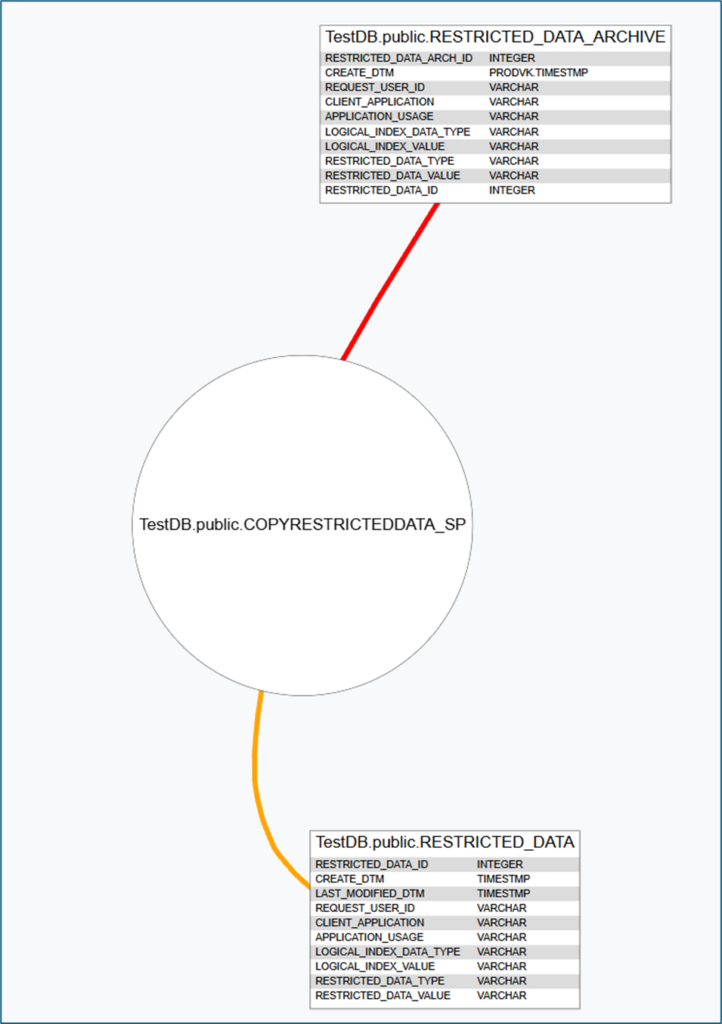
The color of each connection line represents the type of interaction between the module and the connected table:
-
Blue : The module reads data from the table
-
Red: The module has write access to the table.
-
Orange: The module has both read and write access to the table.
-
Black: The module triggers actions or processes related to the table (such as executing a stored procedure or initiating a workflow).
Here are few examples:
Object count in graph view
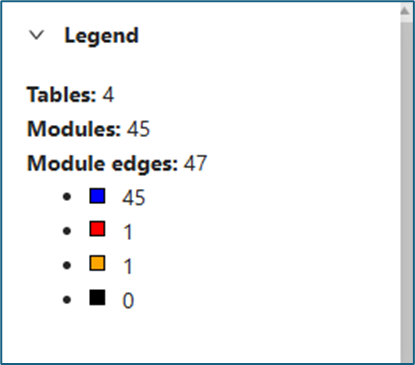
The legend automatically updates to reflect only the connection currently visible in the graph, adapting in real time as users filter or adjust what is displayed on the query page. The legend in the upper left corner of the Query Paths graph displays the object count:
-
For each bounded context:
-
Number of accessed tables
-
Number of modules
-
Number of queries
-
-
Number of unassigned modules
-
Number of queries in unassigned modules
Conflicts
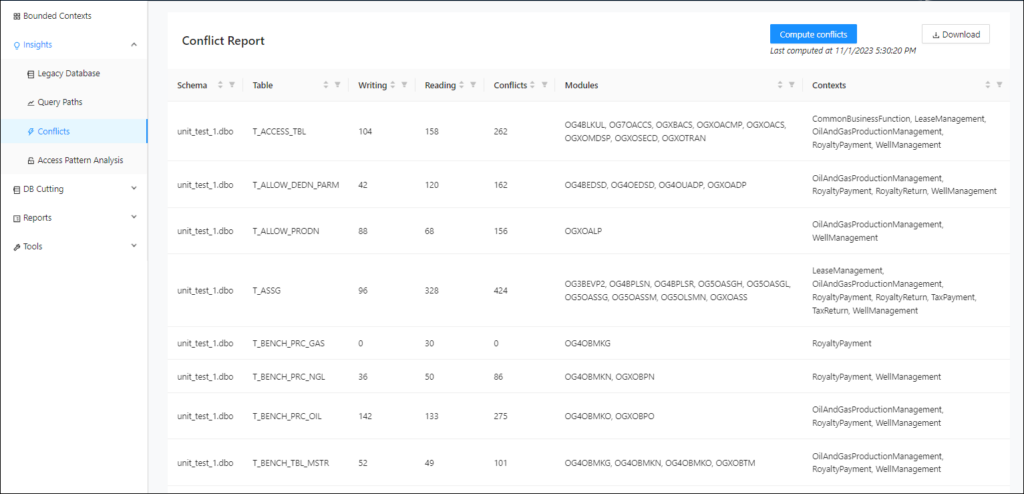
The Conflicts page contains information about the conflicts detected by the Decompose. The queries from each context accessing a column can be reviewed here.
The general workflow is to first import the database schema and then the csv file with the bounded contexts, modules and queries.
To analyze the conflicts in the database, navigate to Insights -> Conflicts and click Compute Conflicts in the upper right corner.
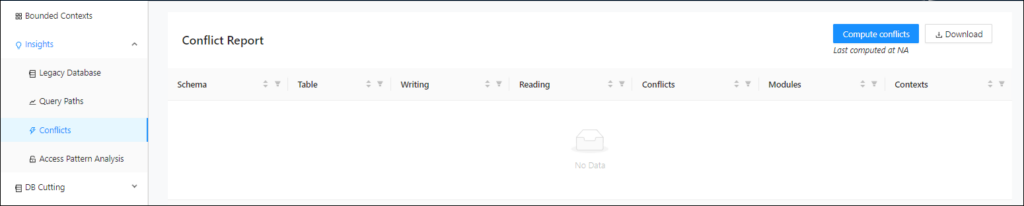
This will start a background task to calculate the conflicts, after which the conflicts will be displayed on the page. This way, the data doesn’t have to be recomputed for each filter/sort operation all over again.
Access Pattern analysis
Use Access Pattern analysis to evaluate how tables and columns are used in application queries before you choose a target data design or database technology. The view highlights which columns are used as access conditions in WHERE clauses and JOIN conditions, which is especially important when you compare modernization options for technologies with stricter and more expensive indexing constraints such as DynamoDB. Use the results to understand how read, write, and filter behavior may influence your target-state decisions.
To see the Access Pattern Analysis features, create a project, upload a valid dbcrawler JSON file, and then upload a valid CSV file in Import contexts, modules and queries under Bounded Contexts.
Query Analysis
Use the search bar to find a table name, for example- table public.RESTRICTED_DATA_ARCHIVE. It shows an overview of the columns of the table used in a WHERE clause or a JOIN condition categorized by SQL statement type (SELECT, UPDATE, DELETE).
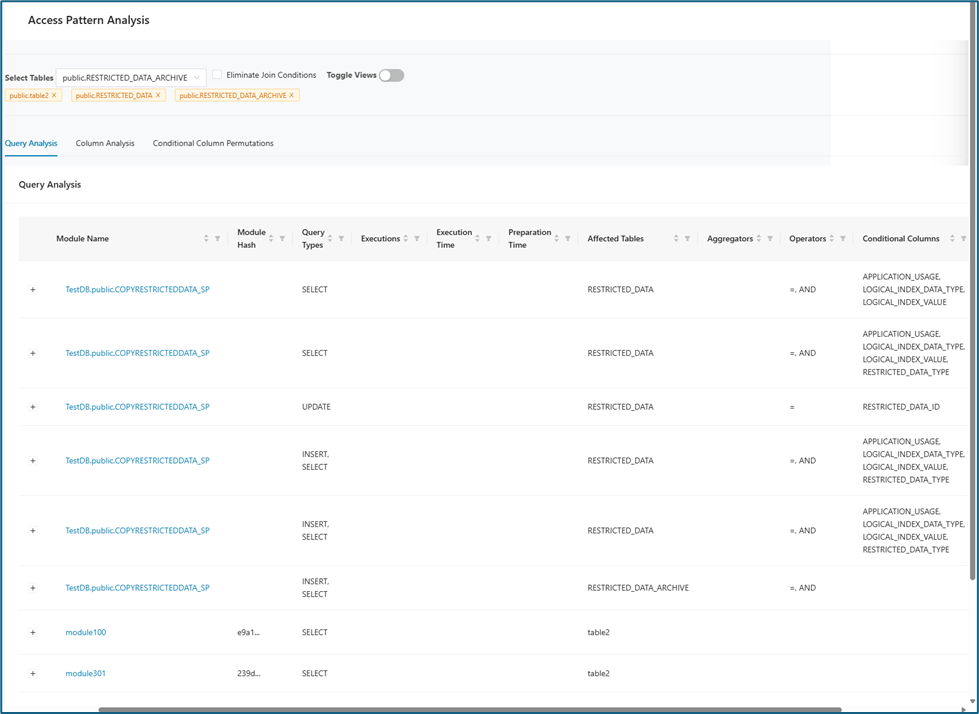
The following table describes the various table headers and their definitions:
| Table Header Name | Description |
|---|---|
| Module Name | The module name to which the query belongs. |
| Module Hash | This is a unique identifier (usually a short alphanumeric string generated by a hash function) for a specific version or state of a code module, stored procedure, or script. |
| Query Type | Type of query. These can be either DELETE, SELECT, INSERT, or UPDATE. |
| Executions | The number of executions of a query in a DB2 database. |
| Execution Time | The execution time in a DB2 database. |
| Affected Tables | The table(s) affected by the query. |
| Operators | The operators used in a query like =, >, etc. |
| Conditional Columns | These columns are within a table or query that are used in WHERE clauses, JOIN conditions, or other logical filters (for example, WHERE COLUMN_A = 'XYZ'). |
| Bounded Context Name | This column indicates the bounded context(s) associated with the module, showing which specific domain areas or functional boundaries within the system the module is part of. |
Column Analysis
Within the Column Analysis tab, you can click any numerical value that appears as a hyperlink. Doing so reveals detailed information about the associated SQL commands such as SELECT, UPDATE, INSERT, DELETE, and WHERE clauses for that column.
The Column Analysis view has been enhanced with the addition of the Where Count column, which accounts for the usage patterns or counts of columns used in the "WHERE clause" of SQL queries. This data point is crucial from an architectural standpoint and for understanding the usage of a column or attribute from the legacy code perspective. This enhancement provides a more comprehensive view of column usage, similar to the existing metrics for Select count, Update count, and Delete count.
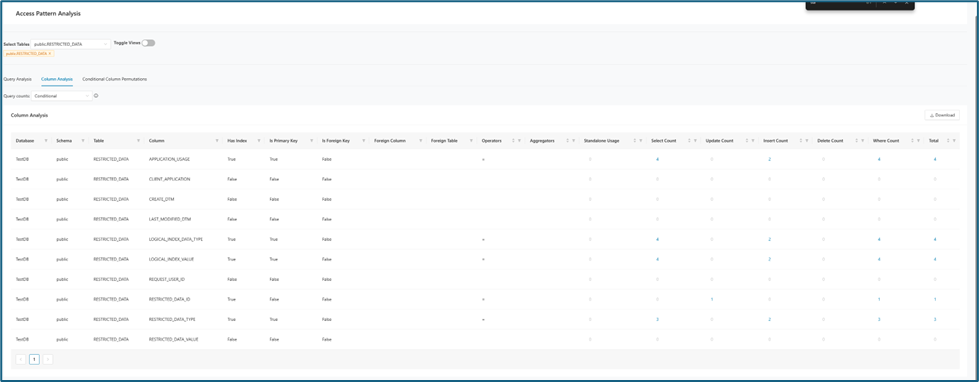
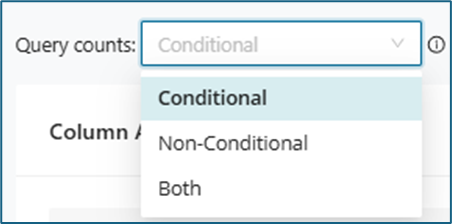
The Query Counts drop-down menu offers three options:
| Option | Description |
|---|---|
| Conditional | Displays queries containing conditions such as the “WHERE” clause for the column. |
| Non-Conditional | Displays queries without conditions for the column. |
| Both | Displays queries both with and without conditions for the column. |
This table provides detailed information about the names and descriptions of each column in the Column Analysis table:
| Table Header Name | Description |
|---|---|
| Table | The content can be filtered by conditions related to the table name. |
| Column | The content can be filtered by conditions related to column name. |
| Has Index | The content can be filtered by True or False. |
| Is Primary Key | The content can be filtered by True or False. |
| Operators | The content can be sorted and filtered by operators. |
| Aggregators | The table content can be filtered by data-gathering aggregators. |
Count column analysis
For this example, the number 4 was clicked in the first row under the Select Count column:
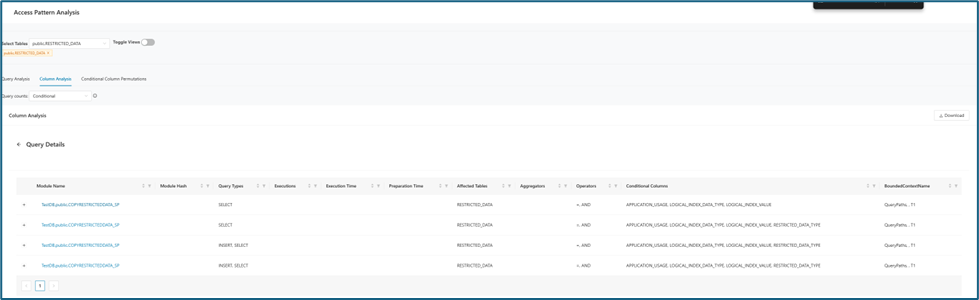
The query details are organized in a clear, tabular format. If you click a module name in this table, the interface redirects you to the corresponding page within the Mining project. That page provides detailed documentation, analytics, and related information about the selected module.
You can run the same analysis for the other columns.
Conditional Column Permutations
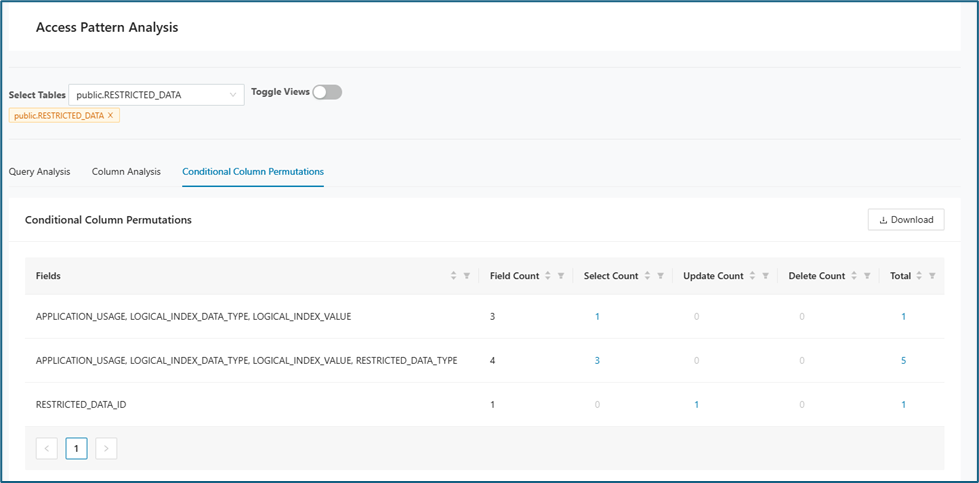
Permutations shows how columns depend on each other. It lists the queries in which those columns are used together in the WHERE clause and helps you understand the dependencies that matter for database cutting.
Reports
This section holds different reports related to the Insights module. All reports could be downloaded as a .csv file.
Module List
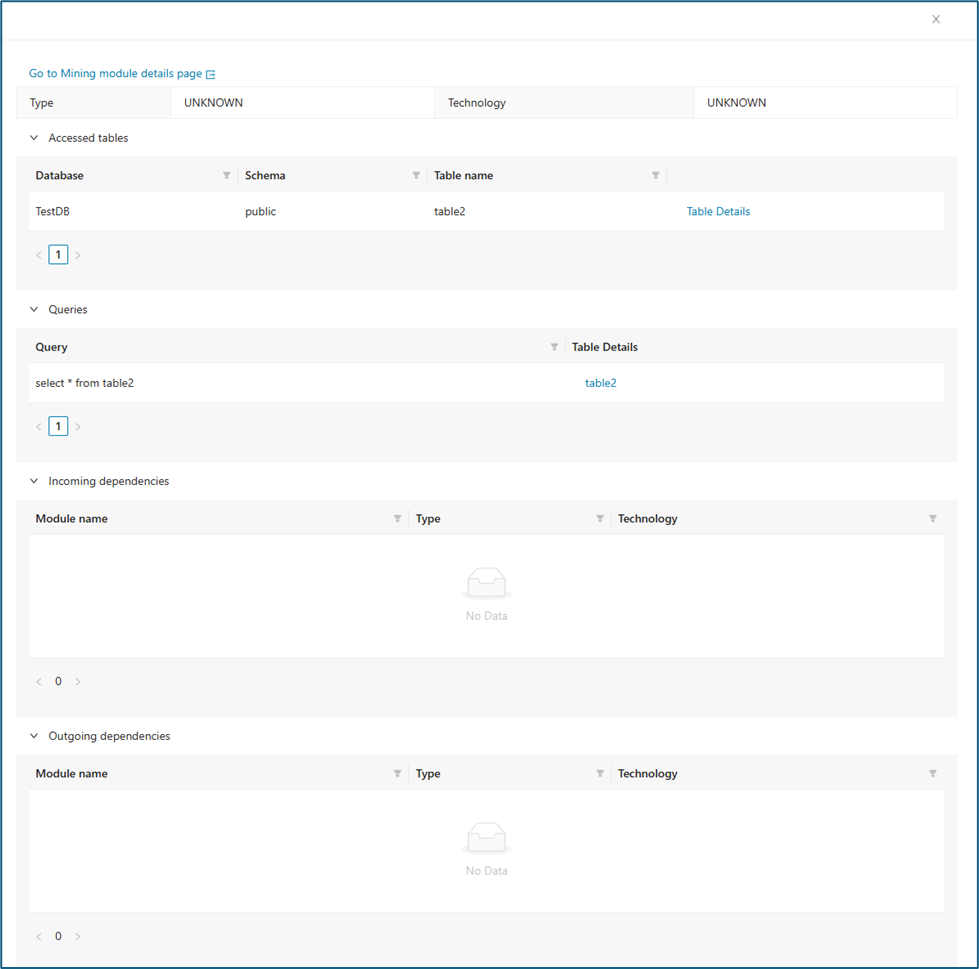
The Module List provides a comprehensive table displaying all modules, including key details such as Name, Module Hash, Path, Module Type, and whether each module is Omitted in Graphs. For added convenience, a direct link to the mining project is also available. Below is a sample screenshot illustrating the module list layout.
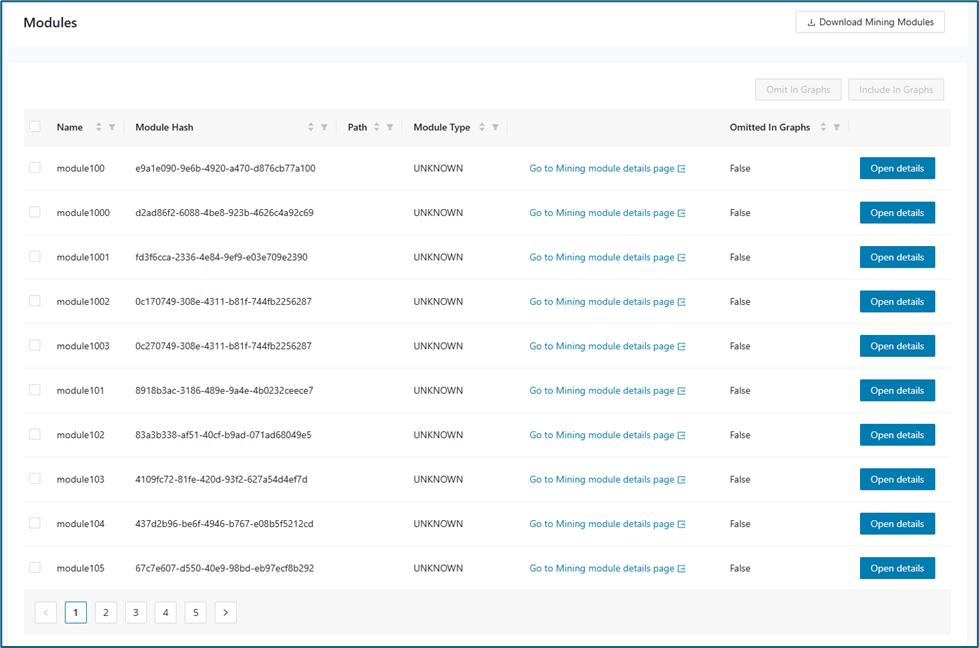
Open Details shows the module relations and the link to the Mining UI.
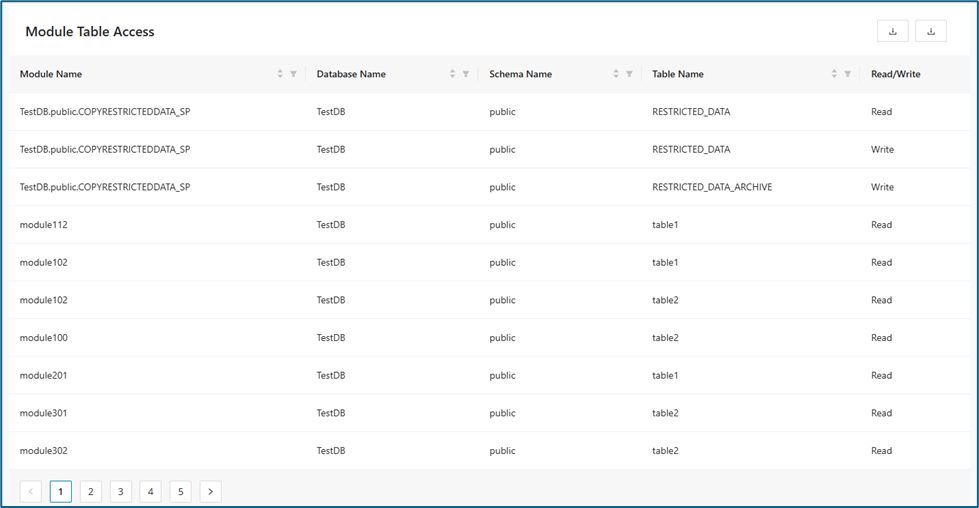
Module Table Access
The Module Table Access section displays a detailed table summarizing which database tables each module can access. Each entry includes the Module Name, Database Name, Schema Name, Table Name, and the corresponding access level (Read or Write). This organized view provides clarity on data permissions across modules.
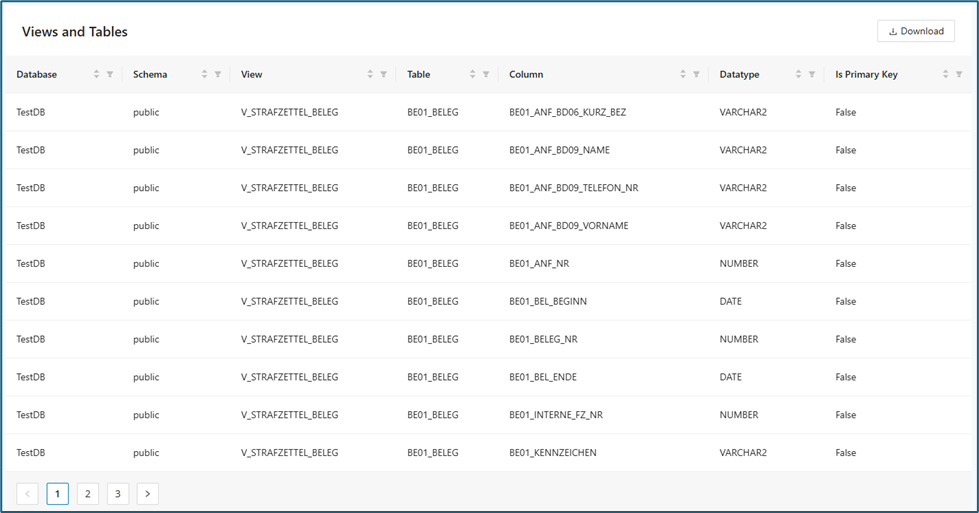
Views and Tables
The Views and Tables section presents a detailed overview of all database views, tables, and their attributes. It lists each view alongside information such as the associated table, column name, data type, and whether the column is a primary key. This organized table enables users to quickly identify data structures and relationships within the database.
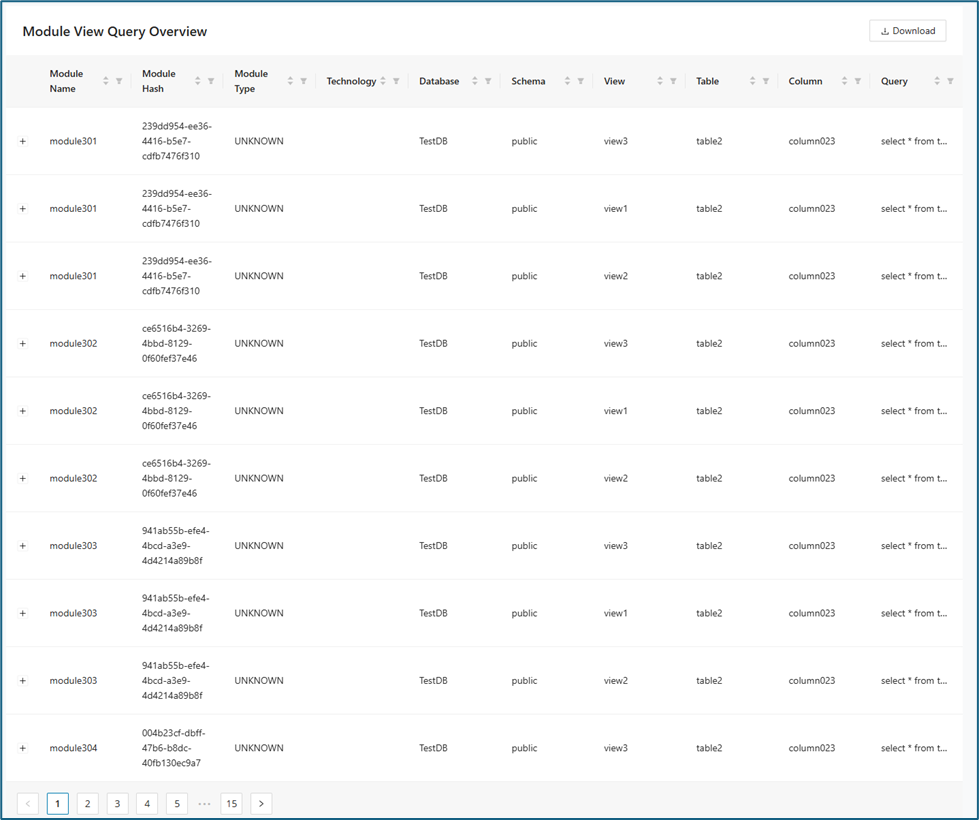
Module View Query
The Module View Query Overview section offers a detailed summary of the queries executed by each module. The table displays the Module Name, Module Hash, Module Type, Technology, Database, Schema, View, Table, Column, and the executed Query. Users can review which queries are associated with specific modules and gain deeper insights into data access patterns.
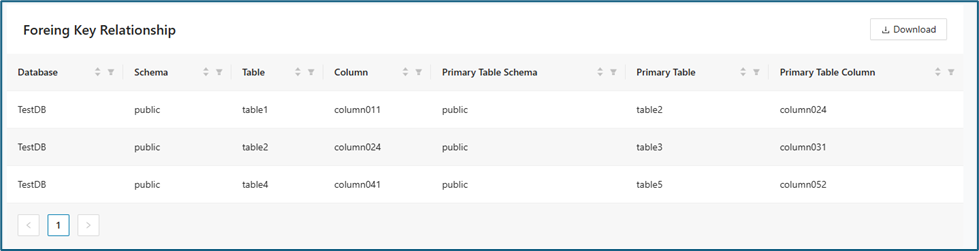
Foreign Key Relationship
This section provides a summary of foreign key relationships in the database. The table lists the database, schema, table, column, and their corresponding primary table and column, making it easy to trace data linkages across tables.
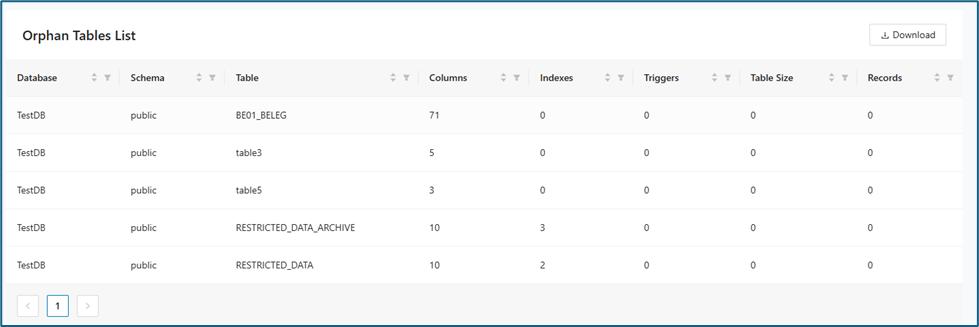
Orphan Tables
This section lists tables in the database that lack foreign key connections, showing their columns, indexes, triggers, size, and record count.