Additional features
The Mining Web UI offers additional features that significantly enhance user experience and functionality across the entire platform. These features are meticulously integrated to ensure seamless access and usability, providing a consistent and efficient interface.
Job Framework
The Job Framework provides a list of both currently triggered and completed jobs. It gives you a central place to monitor long-running actions, review their status, and open related logs. Use it to track background processing without leaving the web UI.
To display the job list, hover your mouse over the job framework icon in the upper right corner.
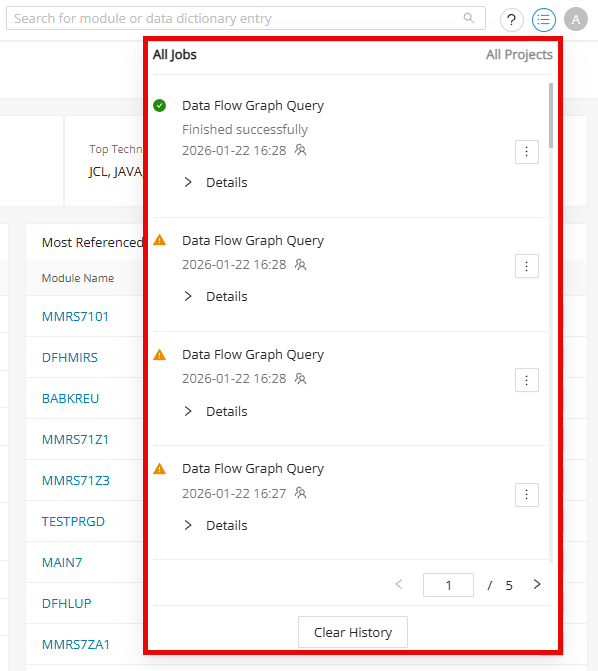
The list can contain the following information about each job:
| State | Graphical information about the job status |
|---|---|
| Running/Loading | |
| Finished Successfully | |
| Stopping/Stopped (Cancel Requested) | |
| Finished with Warning | |
| Finished with Errors | |
| Name | The name of the job. |
| Job State | Information about the status of the job as text. |
| Date and Time | Information about when the job was triggered or finished. |
| User Icon | Information via hover: who started this job (Started by) (only visible for admin users).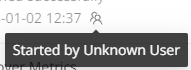 |
| Menu Icon | Options to view the log files or remove this job from the history.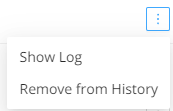 When a job has the status "Running", a STOP is displayed instead of the menu icon. |
The job list displays a maximum of eight jobs per page. To display the other jobs, use the pagination element in the bottom right corner of the job list.
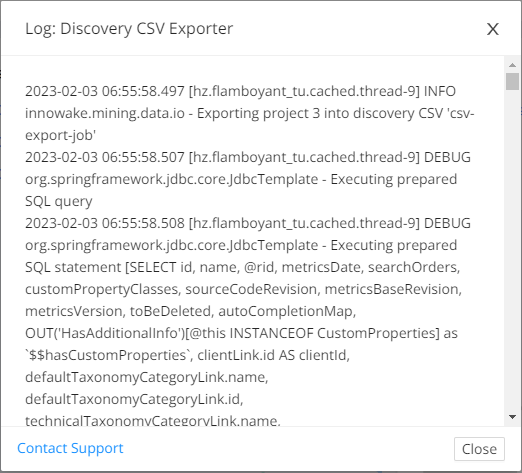
Show log
Each job has logged information that can be viewed by selecting Show Log from the menu icon. A dialog appears with all the logged information for that specific job. In the bottom left corner, there is a mailto link “Contact Support” to the support email.
Compare the log output with the checks in Discovery troubleshooting when a Discovery job finishes with warnings or unexpected results.
Clear history
It is possible to remove a specific job from the list or clear the entire history list.
-
To remove a specific job, select Remove from History from the menu icon next to the job.
-
To clear the entire history, click Clear History at the bottom of the job list dialog.
Users
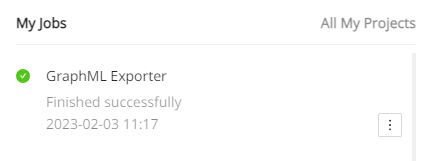
The administrator user sees all user jobs for each project in the job list. Other users can only see their own jobs for each project. Therefore, the user icon in the job list is not displayed for them:
Notification
When a job is triggered, a notification appears with information about the running job. It contains the same information that is displayed in the job list dialog. When a job is completed, the notification contains the Show Log button, which allows you to open the log window directly from the notification. This notification disappears after a short time, but there is the additional option to close this notification manually by clicking .
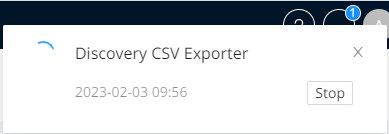
Each status change of a job triggers a notification. This means that a new notification will appear when the current job gets the "Finished successfully" status.
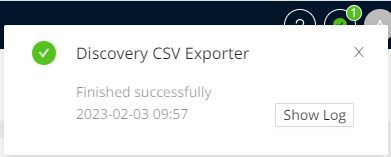
A notification is displayed for each triggered job.
In addition to the notification, the icon in the job list changes its state and shows the same status as the triggered job. For example, if a job is currently running, the icon in the job list will display a running icon.
Show result
The following jobs will display the result after they successfully finish running.
After clicking Show Result , the jobs will redirect to the corresponding summary page as below:
-
Discovery Code completion notification redirects to the Metrics > Summary page.
-
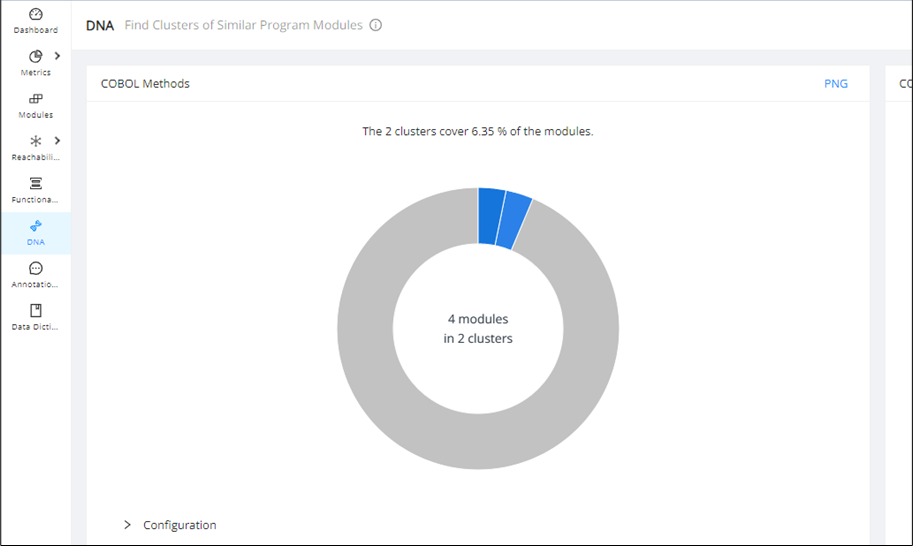
Discovery DNA completion notification redirects to the DNA Overview page.
-
Discovery Metrics completion notification redirects to the Metrics > Summary page.
-
Taxonomy Import completion notification redirects to the Taxonomy Management UI.
-
Control Flow Graph Calculation completion notification redirects to the CFG for the module.
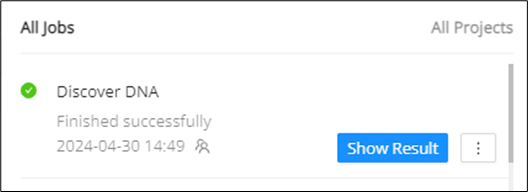
For example, in the "Discover DNA" job below, clicking Show Result will redirect the user to the DNA Overview page.
Saved Search
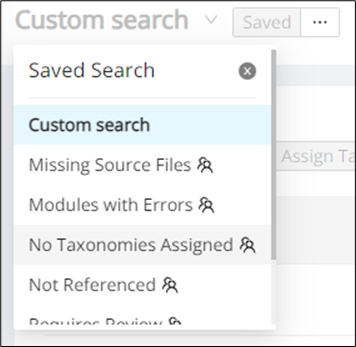
The Saved Search feature allows you to quickly pull up a custom table view with all of the required filters and columns. Saved Search can be found in the top left corner of the Modules, Reachability, Annotations, and Data Dictionary pages with a drop-down list that stores the default and custom saved searches.
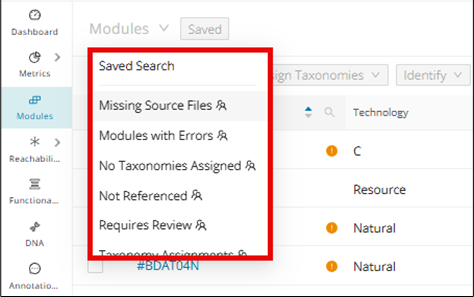
Default saved search for Modules
-
Missing Source Files
-
Modules with Errors
-
No Taxonomies Assigned
-
Not Referenced
-
Requires Review
-
Taxonomy Assignments
Default saved search for Reachability
-
Producer Reachability Blocks
-
Reachability Blocks Performing DB Operations
-
Utility Reachability Blocks
-
Reachability Blocks Performing General Operations
-
Reachability Blocks With Programs
Default saved search for Annotations
-
Business Rule Candidates
-
Database Candidates
-
Dead_Code
-
Ungrouped Annotations
Default saved search for Data Dictionary
-
Business Related DD Entries
-
Copybook Defined DD Entries
-
Field Level Mining Candidates
-
Grouped DD Entries
-
Not Referenced DD Entries
Creating and sharing Saved Search
Making any change to the default table view from the Modules, Reachability, Annotations, or Data Dictionary pages will enable the Save Search feature. For example, sorting/filtering any column (for example, Module Name) or adding a new column from the settings icon in the top right of the table view is enough to enable the Save Search... button. Click the undo icon next to the Save Search... button to return to the default table view.
When you have the desired custom table view, click Save Search... . Enter the title of the Saved Search, select the "Share With" option as required, and click Save .
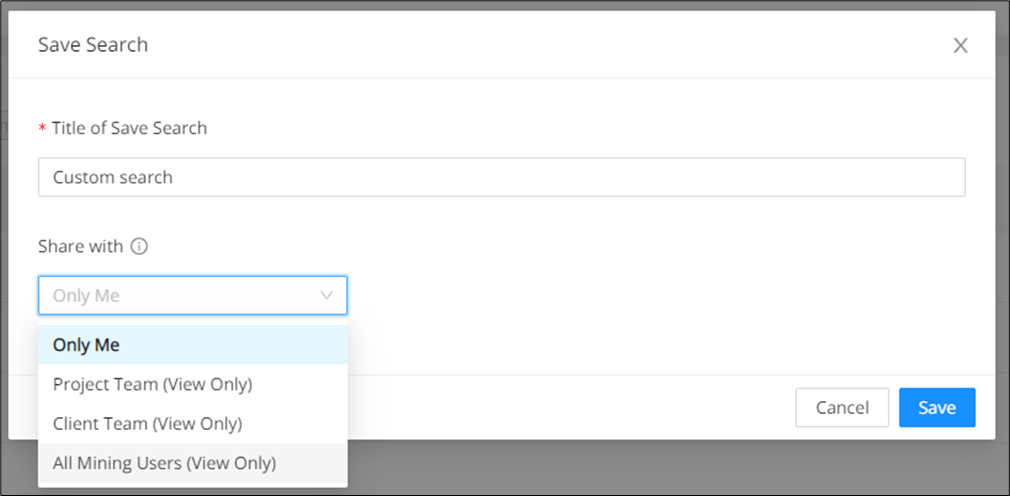
Once saved, the search created will appear in the page header drop-down list.
Hover over the menu next to the page header and then hover again over "Share With" to share the created search.
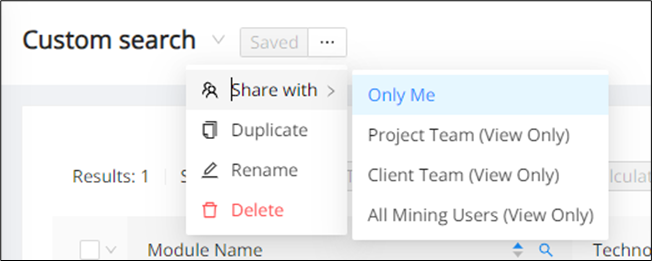
A search can be duplicated, renamed, and deleted by selecting the Duplicate, Rename, and Delete options, respectively.
Only the creator of the saved search can edit, but it can be shared with view-only access. When the saved search is shared, it can be shared with the following scope options:
-
Project Team: The search created can be viewed by all team members within the project.
-
Client Team: The search created can be viewed by all team members for all the projects with the same client.
-
All Mining Users: The search created can be viewed by all team members with administrative rights.
The team members can view the creator of the saved search. The user icon shown below is displayed next to the search name in the header, which contains a tooltip with the following information:
-
The scope of the saved search
-
The creator of the search
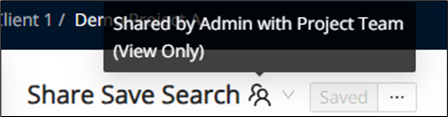
No duplicate search names are allowed on a client level. Thus, if a search is shared with the Client Team, no two projects under two different clients can have the same search name.
In the case this happens, an error message as “Duplicates not allowed” will be displayed:
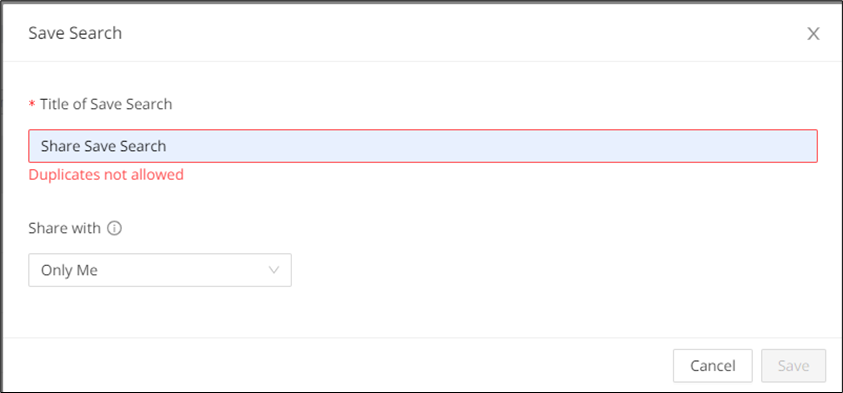
Error display
Errors and missing files will clearly and intuitively be displayed across multiple tabs, designed to streamline workflow by making it immediately obvious which items contain errors or missing files. These indicators help you spot problematic modules and views quickly while you work. Use the sections below to see where error counts and missing-file markers appear across the UI.
Error display in Dashboard
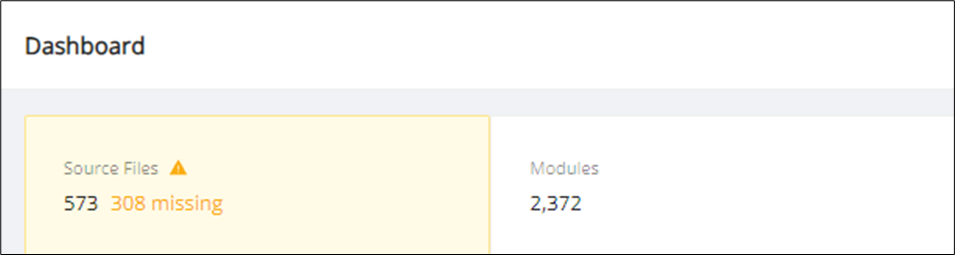
By default, the application is in real-time mode, and you can see modules with errors and missing files on the "Dashboard" page.
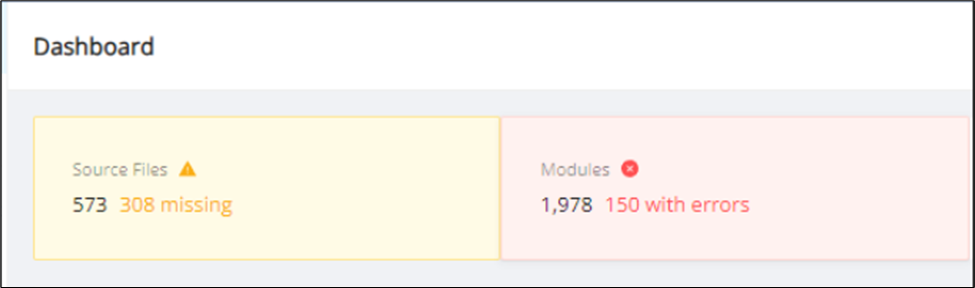
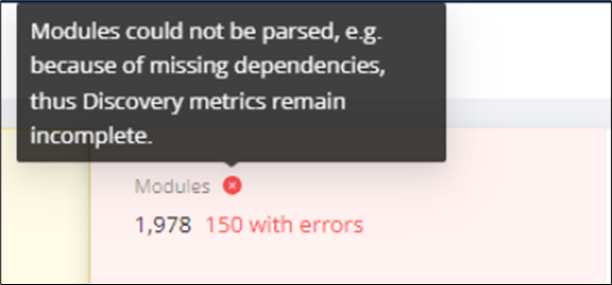
Hover over the red to read the tooltip.
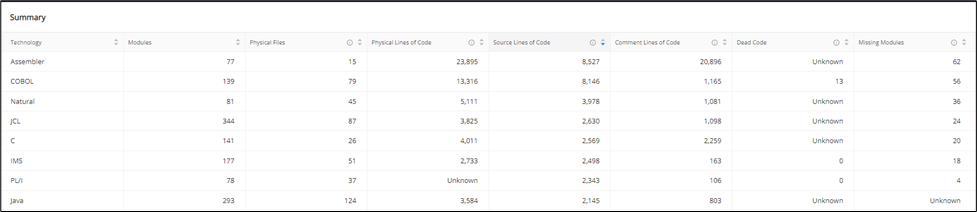
You can see the Errors column in the Metrics Summary page, which is inside the Summary table

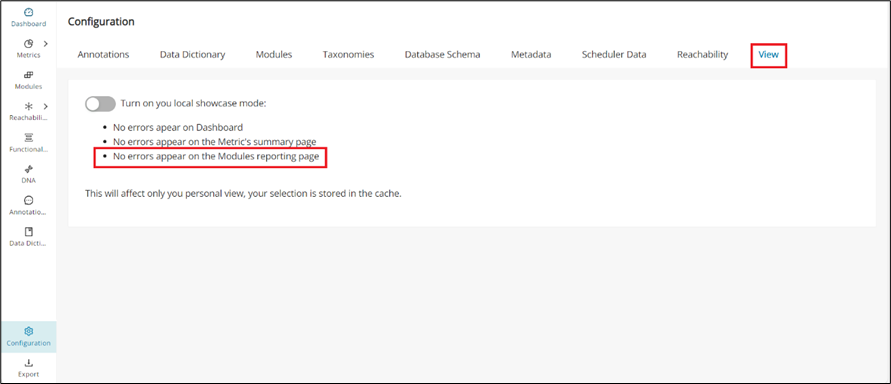
To switch to the demo project, navigate to the Configuration page and click the View tab. Inside the view tab, switch on/off "local showcase" mode to switch to the demo project and back to the real project.
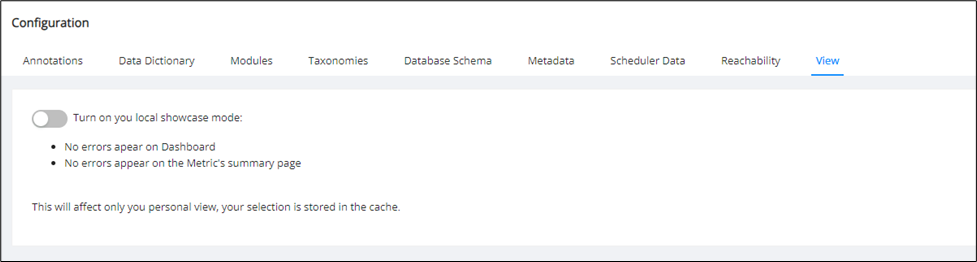
After turning on the switch, the project is switched to demo mode. The "Dashboard" page will not display the error count and icon inside the Modules section.
The Metrics Summary page will also no longer display the Errors column inside the summary table
Global search for errors in Modules
Number of errors data point
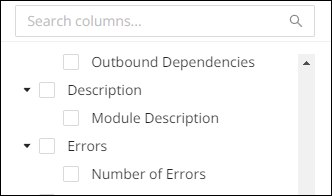
In the columns list on the Modules page, the "Errors" section contains the data point "Number of errors". Check the box to add the “Number of Errors” column to the modules table.
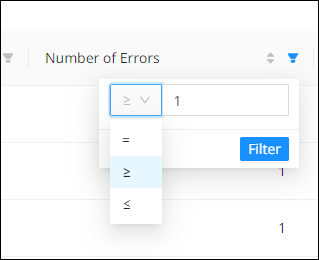
By default, the column is not filtered, but you can filter it by specifying the error count, which is a numeric value, and the filter status between =, ≤ and ≥.
When filtering the column, the entire module table is filtered out based on the applied filter.
Using Global Search to find Modules with errors
On the Modules page, the global search dropdown contains the option "Modules with Errors".
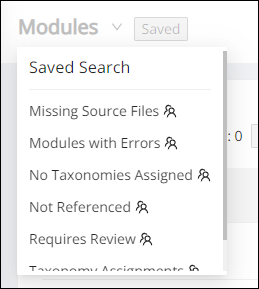
If you click this option, the module table will be automatically filtered by adding by adding the column "Number of errors" to the table and setting the number of errors to "1" and the filter status to "≥".
On the Dashboard page, the clickable Modules card displays the number of modules with errors.
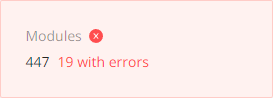
If you click the Modules card, you will be redirected to the Modules page with the global search "Modules with Errors".
The Results displayed in "Modules with Errors" show the same number of modules with errors as the Modules card.

Missing Modules and errors in Modules page
Missing modules or modules containing errors will have an indication next to the module's name.
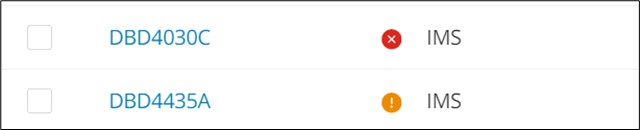
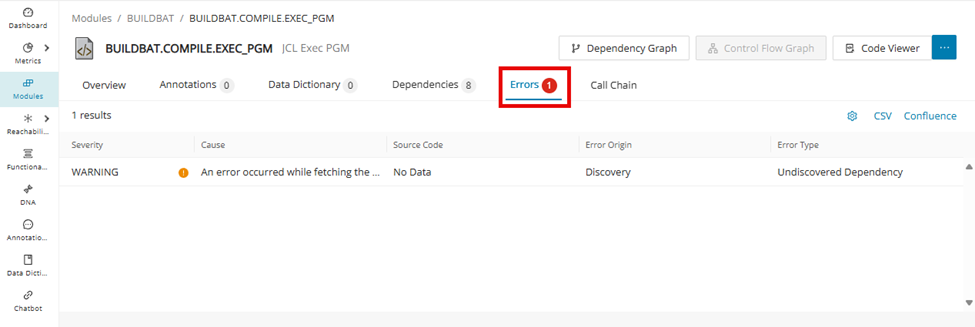
To find more specific information on the errors and warnings of a given module, click the module and switch over to the "Errors" tab.
To disable this indicator, enable "local showcase mode", which can be found in the Configuration page under the View tab.
Error display in Module Details
Dependency errors on the Call Chain
In the Central Call chain page, click Render Graph and a graph will be generated.
If you have any dependency errors in the modules, the Errors/Missing Dependencies label and total count will be visible next to the Call Chain Page header.

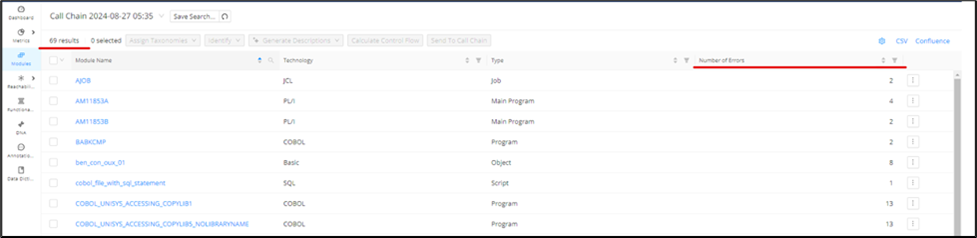
When you click the Errors label, a new Modules table will open with the default column “Number of Errors”. The total results in this new table are equal to the number of dependency errors in the module.
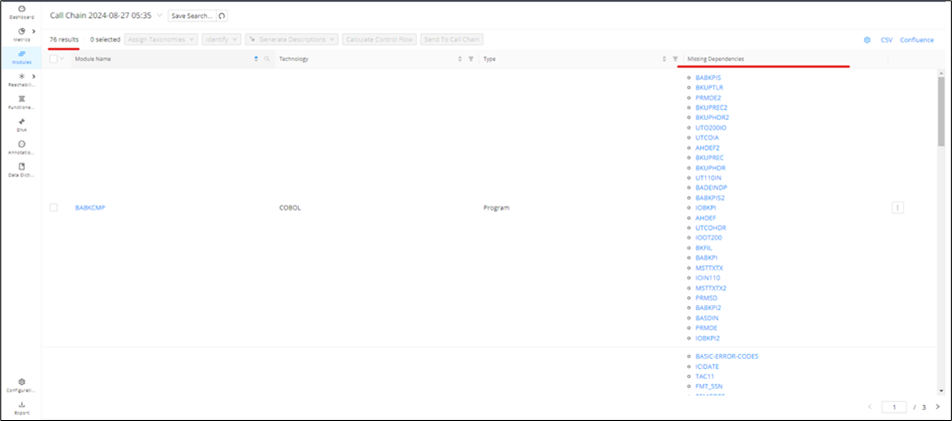
When you click the Missing Dependencies label, a new Modules table will open with the default column "Missing Dependencies". The total results in this new table are equal to the number of missing dependencies in the module.
Error display in Reachability Analysis
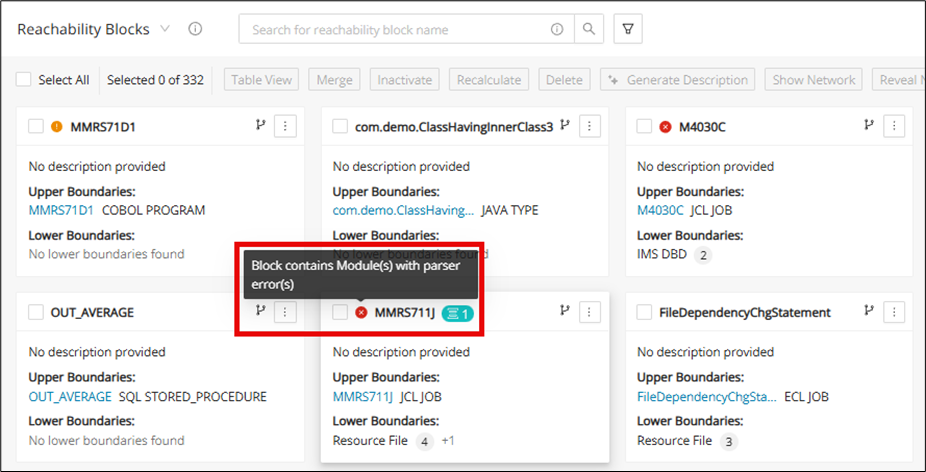
After a Code Discovery and Reachability Analysis calculation, the dependencies that could not be properly resolved will come with an error and/or missing dependencies indicator to let you know where there were issues with the Discovery. You can find these indicators within the Reachability Analysis page from the following:
1. Block screen
2. Block details
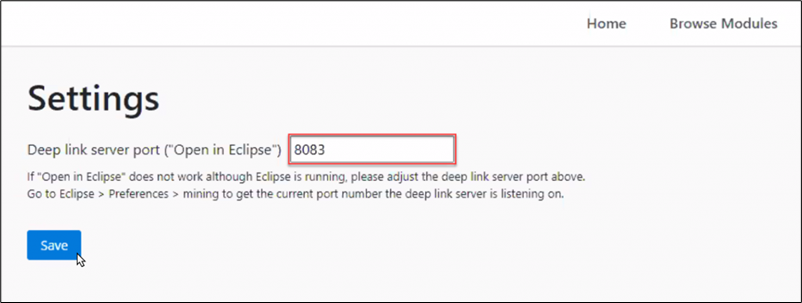
3. Table view
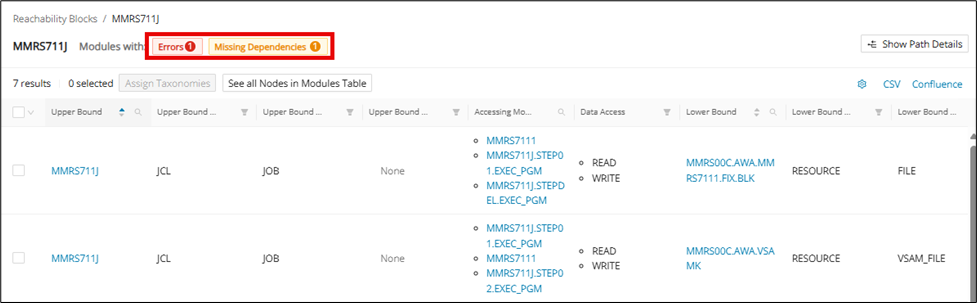
4. Graph view
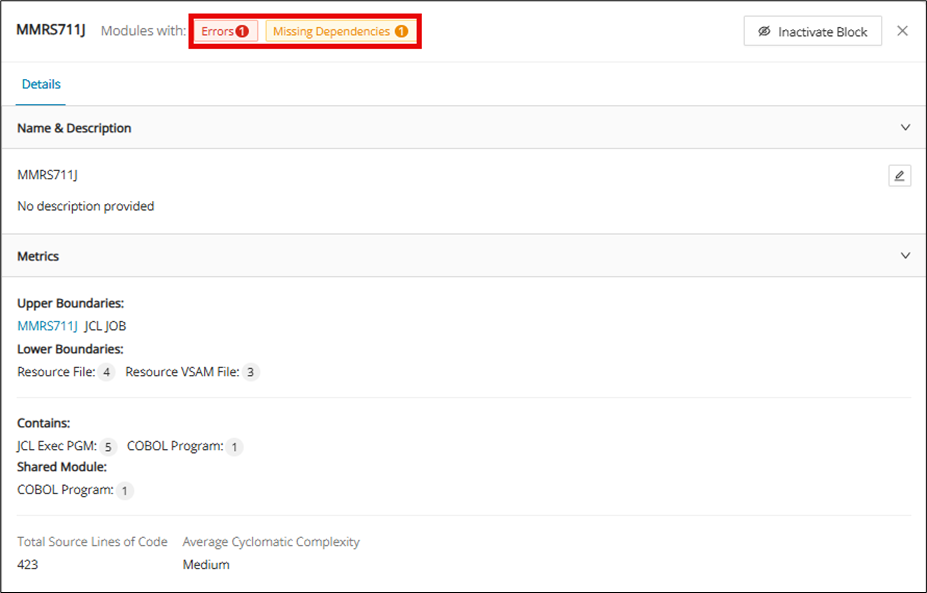
Clicking these indicators produces a new tab with a table to show the modules that have an error or missing dependency.

If a Reachability Block contained inside a Merged RB contains any errors and/or missing dependencies, the merged block will also reflect the same in the tiles view, like a single reachability block.
Table view
Tables are useful for sorting, filtering, selecting, and performing many other actions to manipulate data so that it is easier to handle. This section will detail some of the actions that the Table View in Mining Web UI has to offer.
Bulk actions
Inside the module table, the user can select a bulk number of modules by hovering over the module selection drop-down menu located just to the left of the “Module Name” column. The user can choose between two options: "Select All" to choose all the modules in the table, or "Select Current Page" to select all modules present in the current page.
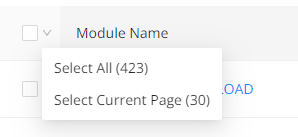
If you choose "Select All" from the drop-down list, the "Deselect All" and "Deselect Current Page" options will appear in the drop-down list.
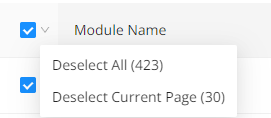
If you choose "Deselect Current Page", all modules on the current page will be deselected, and the options will be refreshed based on the status.
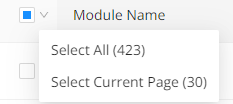
Now the "Select All and "Select Current Page" options appear in the drop-down menu. If you choose "Select Current Page", all modules on the current page will be selected again.
Subsequently, the "Deselect All" and "Deselect Current Page" options are displayed. If you choose "Deselect All", all modules will be deselected.
You can also press the module selection button itself to select or deselect all modules.

Filters in table view
Filter is a common feature for the table views in the Mining Web UI and is used to enable/disable which columns are shown on the table view. Simply click the settings icon, which is located at the top right of the table view, to find a drop-down of all of the available columns. To quickly find the column within the filter, type in the column name in the search bar located at the top of the filter.
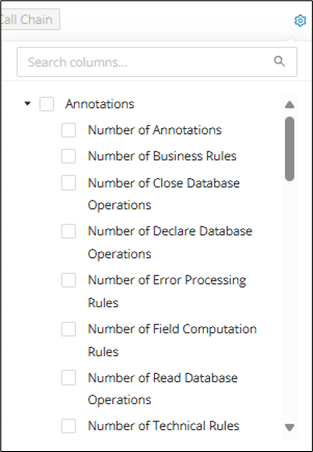
Each column has a combination of a search, sort, and/or filter function based on its specific use.
| Icon | Description |
|---|---|
Search icon, commonly used for "name" columns.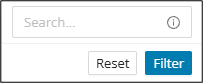 Search bars with the info tooltip support wildcard search syntax abc* : search ends with "abc" *def* : search contains "def" anywhere xyz* : search starts with "xyz" |
|
|
|
Sort icon, used to sort items in this column (A-Z, Z-A, numerically). |
Category Filter icon, used to include or exclude items found within this column.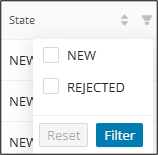 |
|
The Number Filter icon can filter numbers with the added function of =, ≥ or ≤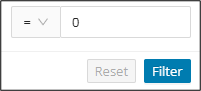 |
Filters in Modules page
The default columns that can be found on the Modules page are in the following order:
-
Module Name
-
Technology
-
Type
-
State
-
Last Scan
This can, of course, be customized by going into the Filter, which contains the following columns
| Category | Column | Function(s) | Additional Info |
|---|---|---|---|
| Annotations | Number of Annotations | Sort, Number Filter | |
| Number of Business Rules | Sort, Number Filter | ||
| Number of Close Database Operations | Sort, Number Filter | ||
| Number of Declare Database Operations | Sort, Number Filter | ||
| Number of Error Processing Rules | Sort, Number Filter | ||
| Number of Field Computation Rules | Sort, Number Filter | ||
| Number of Read Database Operations | Sort, Number Filter | ||
| Number of Technical Rules | Sort, Number Filter | ||
| Number of Validation Rules | Sort, Number Filter | ||
| Number of Write Database Operations | Sort, Number Filter | ||
| Percentage of Annotated Statements | Sort, Number Filter | ||
| Base Data | File Identified / File Missing | Category Filter | |
| In Codebase | Sort, Category Filter | ||
| Module Id | |||
| Module Name (Mandatory) | Sort, Search | ||
| Path | Sort, Search | ||
| Requires Review | Sort, Category Filter | ||
| Tracked Module Definement | Category Filter | ||
| Technology (Mandatory) | Sort, Category Filter | ||
| Type (Mandatory) | Sort, Category Filter | ||
| State | Sort, Category Filter | ||
| Dependencies | Inbound Dependencies | Search | |
| Missing Dependencies | Search | ||
| Number of Dependencies | Sort, Number Filter | ||
| Number of Inbound Dependencies | Sort, Number Filter | ||
| Number of Outbound Dependencies | Sort, Number Filter | ||
| Outbound Dependencies | Search | ||
| Description | Module Description | Sort, Search | |
| Errors | Number of Errors | Sort, Number Filter | |
| Metrics | Comment Lines of Code | Sort, Number Filter | |
| Complexity Level | Sort, Category Filter | ||
| Lines of Dead Code | Sort, Number Filter | ||
| Physical Lines of Code | Sort, Number Filter | ||
| Program Complexity | Sort, Number Filter | ||
| Source Lines of Code | Sort, Number Filter | ||
| Modifications | Last Modified | Sort | |
| Last Scan | Sort | ||
| Reachability Blocks | Reachability Block Name | Sort, Search | |
| Taxonomies | Number of Assigned Taxonomies | Number Filter | |
| Technical Taxonomies | DB Access | Category Filter | |
| File Access | Category Filter | ||
| Operations | Category Filter | ||
| Program Type | Category Filter | ||
| Utility | Category Filter |
Export table as CSV
Tables in the Mining Web UI can easily be exported as a .csv file by clicking CSV on the top right of the table view. Use the Filter feature to include/exclude all of the relevant columns before exporting the CSV.
For example, you can include all columns related to "Technical Taxonomies" in the table, which will then be included in the CSV export.
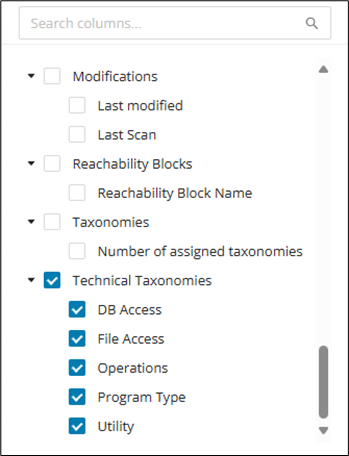
Click CSV to download the CSV file.
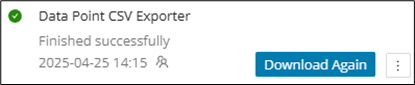
Export table for Confluence
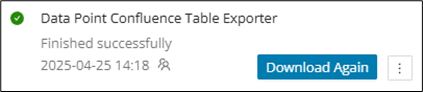
Tables in the Mining Web UI can easily be exported as a .txt file, which can be used to create a table in Confluence. Use the Filter feature to include/exclude all of the relevant columns to prepare the table for export, and then click Confluence at the top right of the table view. The .txt file will be ready to download when the "Data Point Confluence Table Exporter" job is complete.
REST API with Swagger
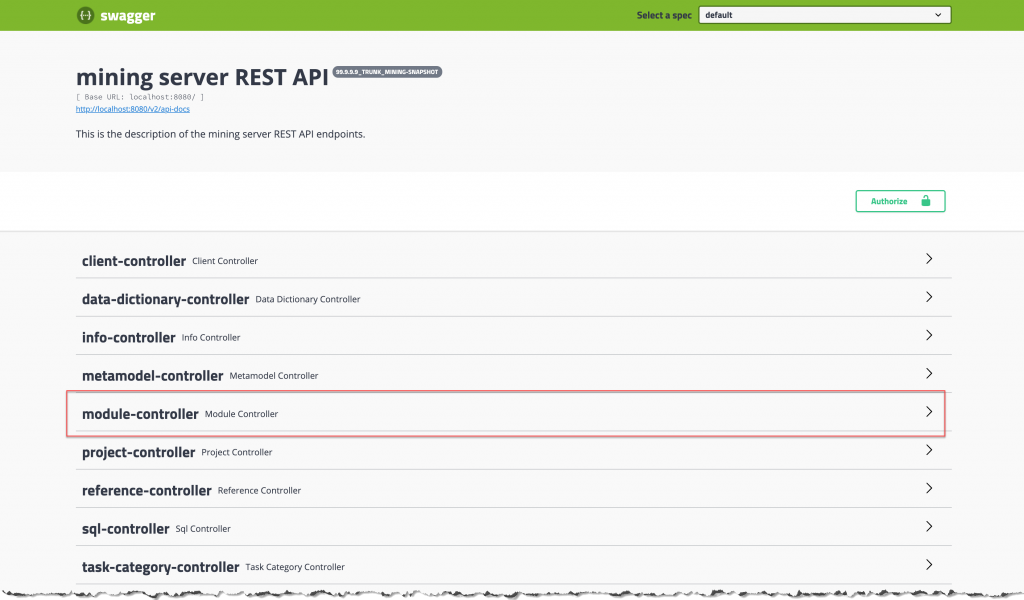
As an alternative to the plug-in, developers can implement their own Java project to implement further functionalities using the REST API (for example, custom reports). The Swagger UI provides a browsable entry point for exploring available endpoints and request models. Use it when you want to inspect the API surface or prototype calls outside the Eclipse plug-in.
To access the REST API, open http://