Bounded Context Graph
The Bounded Context Graph visualizes bounded contexts and module relationships. Bounded contexts can be exported from Mining or generated in Decompose.
For this workflow, use Project > Test 3 and open Decomposition > Bounded Context Graph.
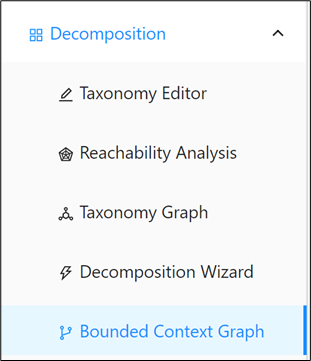
Use this page to inspect cross-context dependencies and refine context boundaries before reviewing BC candidate reports.
Quick start: search and filter contexts
The quickest way to work in the graph is to narrow the visible context set before making any changes. Searching and filtering reduce visual noise and make it easier to focus on the modules or contexts relevant to the current review. Start here whenever the graph is too dense to inspect comfortably.
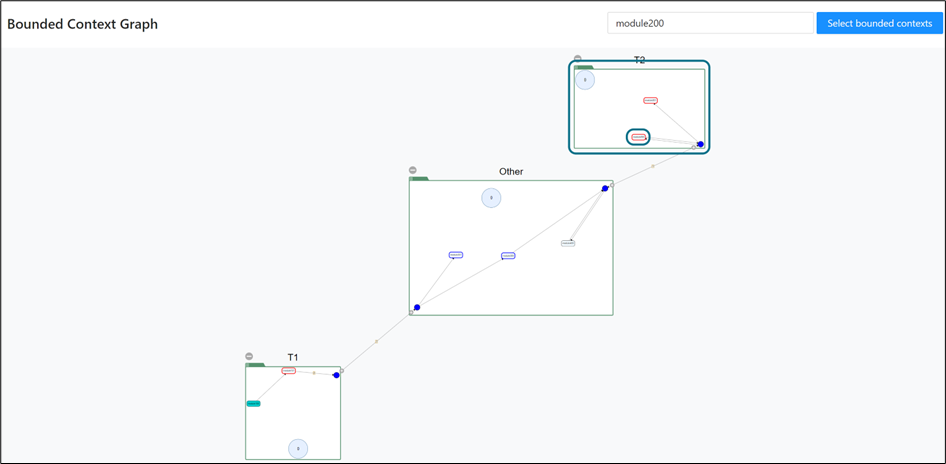
Step 1: Search for a module in the search field.
Expected output: matching bounded contexts are highlighted with a dark border.
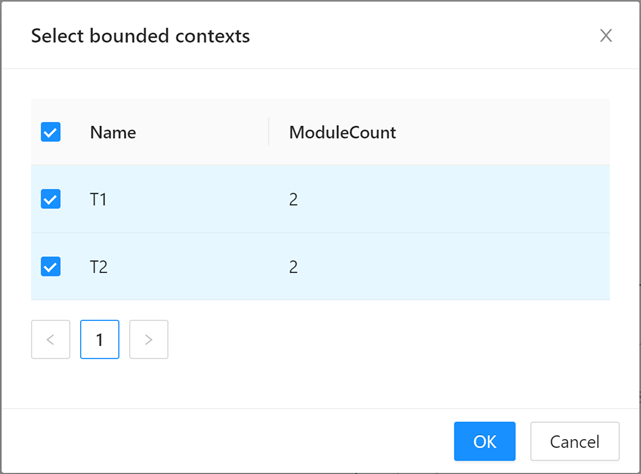
Step 2: In the context list, select only the bounded contexts you want to display.
Expected output: selected contexts remain visible and unselected contexts are hidden.

Step 3: Select contexts one-by-one or use the checkbox beside Name to select all.
Understand graph elements
Before you move modules or interpret edges, make sure you understand what the graph is showing. The labels, boundaries, and edge patterns all carry meaning that affects decomposition decisions. This section summarizes the visual elements you will use throughout the graph workflow.
The graph shows bounded context names and the boundary modules shared across contexts.
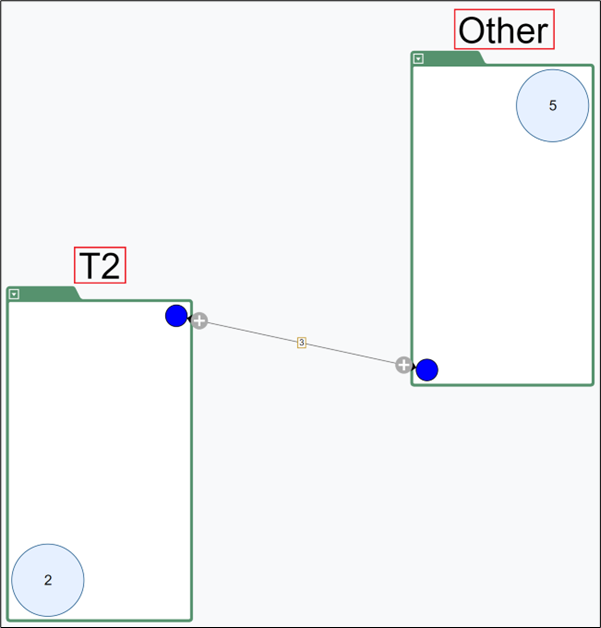
Boundary module relationships are represented by edges between contexts.
Inspect connections in the drawer
The drawer is the detailed inspection area for a specific relationship between two contexts. It lets you review the modules involved, assess the impact of moving them, and preview how boundary changes affect connectivity. Use it when the high-level graph indicates a relationship that needs a closer look.
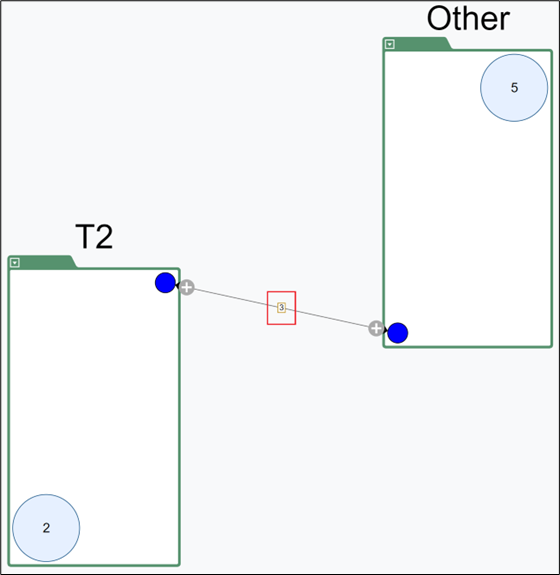
Step 1: Click an edge between two contexts.
Expected output: a drawer opens showing boundary modules and connection details.
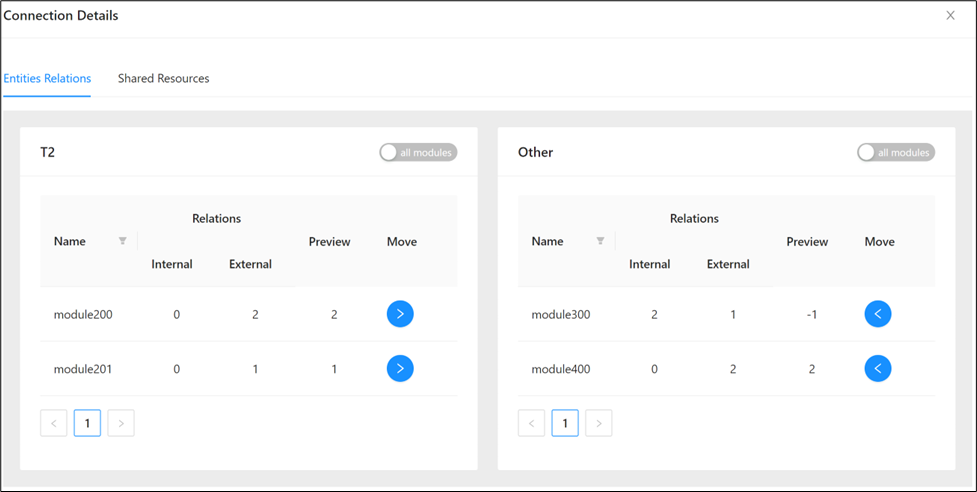
Step 2: Review module names, internal/external connections, and preview impact if modules are moved.
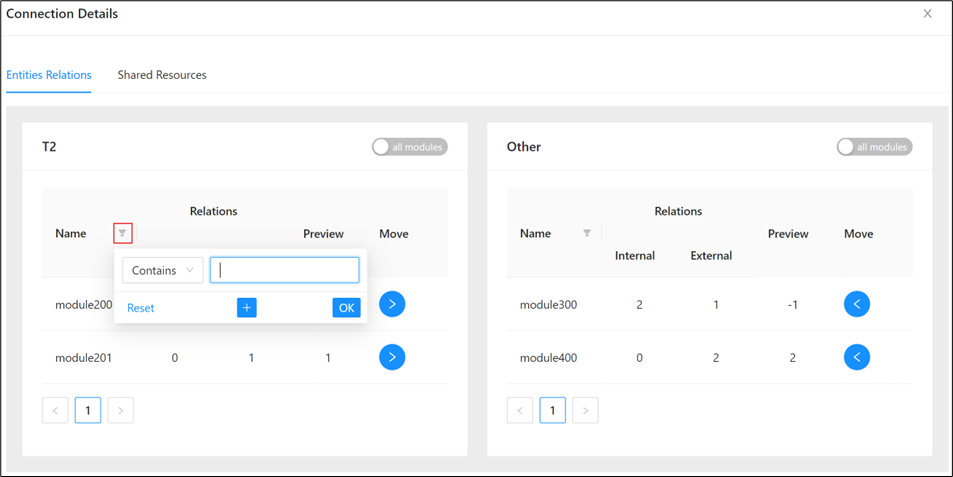
Step 3: Use the drawer filter to narrow the module list.
Expected output: only matching modules remain visible in the drawer list.
Step 4: Use and to move modules between contexts.
Expected output: module ownership updates and connection previews reflect the new assignment.
Step 5: Toggle all modules when you need to inspect more than boundary modules.
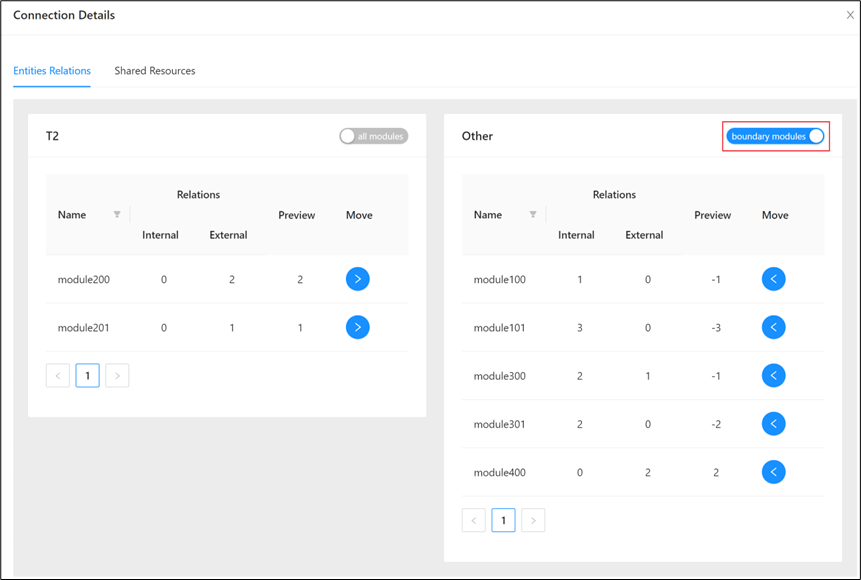
If all modules is disabled, boundary modules and all modules are currently the same set.
Expand contexts and module-level relations
Expanding contexts exposes the individual modules and connections hidden behind the summary circles. This deeper view helps you distinguish between broad context-level coupling and a small number of specific module dependencies. Use it when you need to understand why two contexts appear connected.
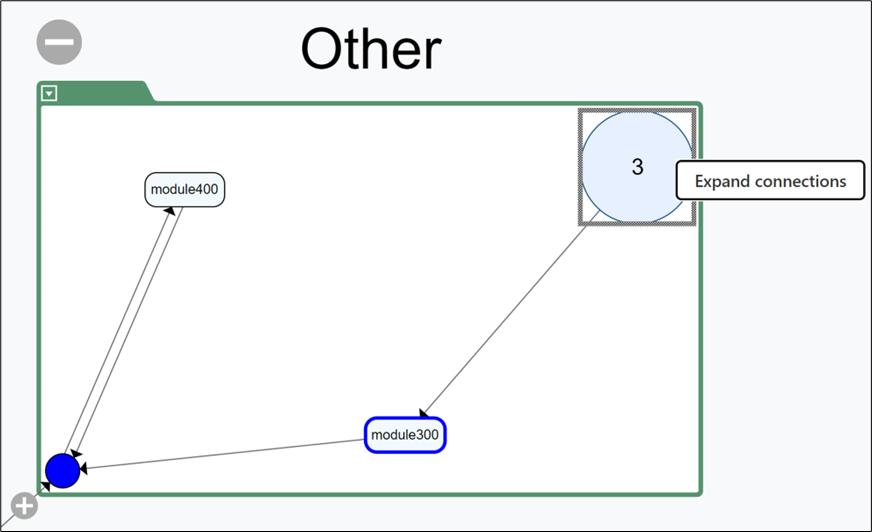
Unexpanded modules are shown as module-count circles.
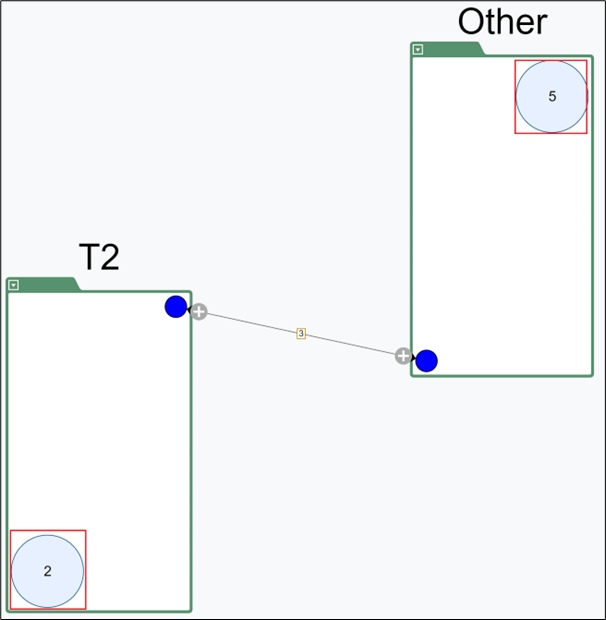
Step 1: Click the icon on an edge to expand contexts.
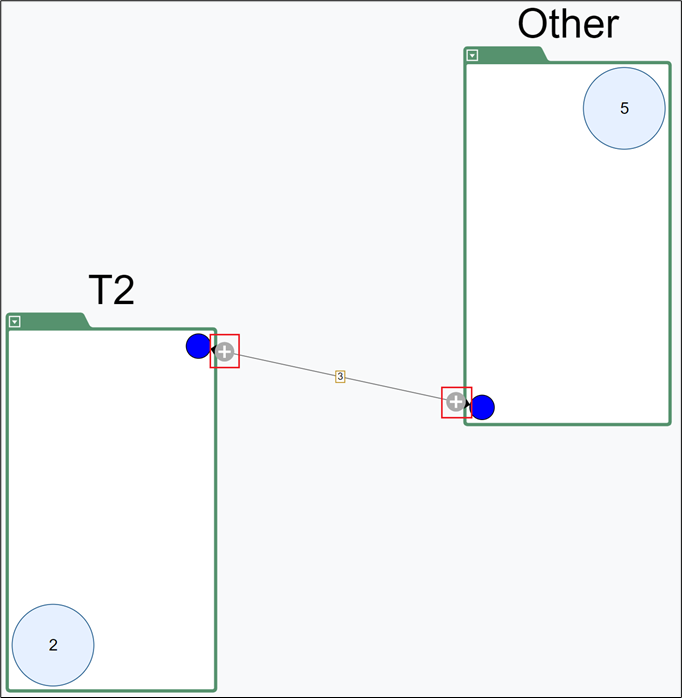
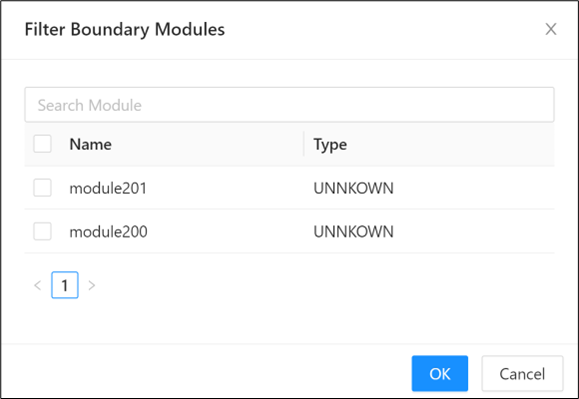
Step 2: In the selection dialog, choose modules and click OK.
Step 3: Review the expanded result.
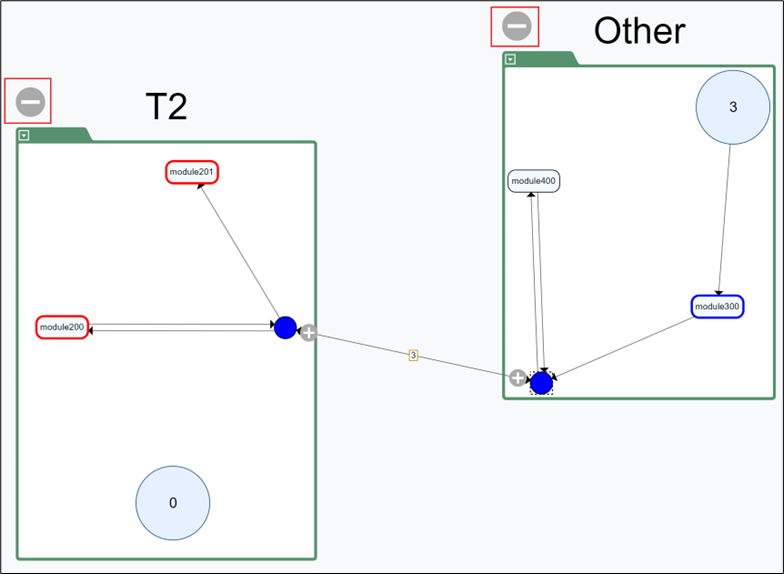
Expected output: expanded modules are shown, and fully expanded context circles can show a module count of 0.
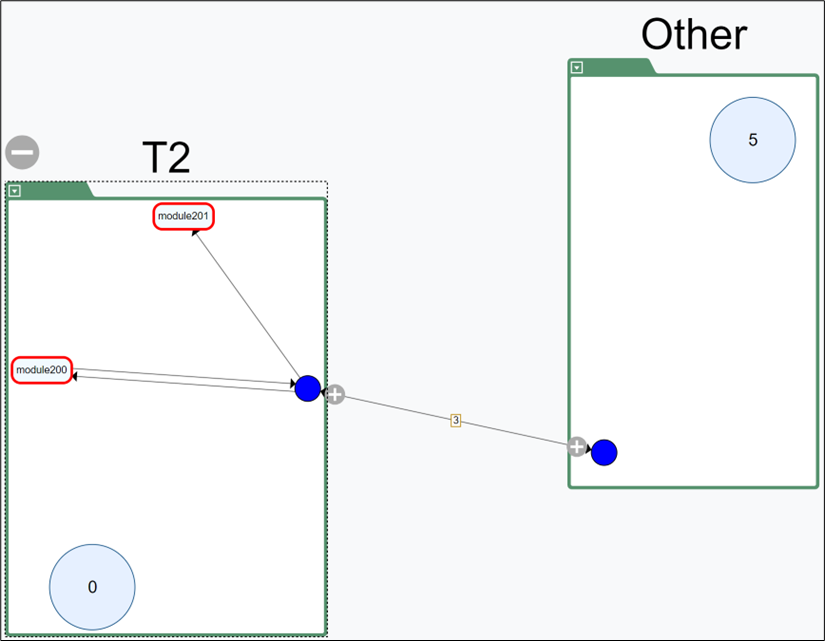
The graph can show modules with no internal links but external connections to other contexts.
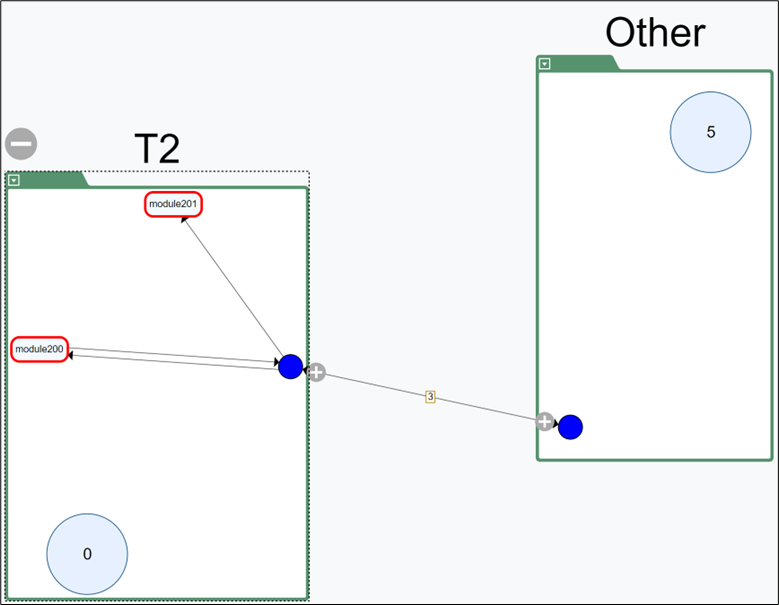
Step 4: To expand selectively, right-click the blue edge control and choose incoming or outgoing expansion.
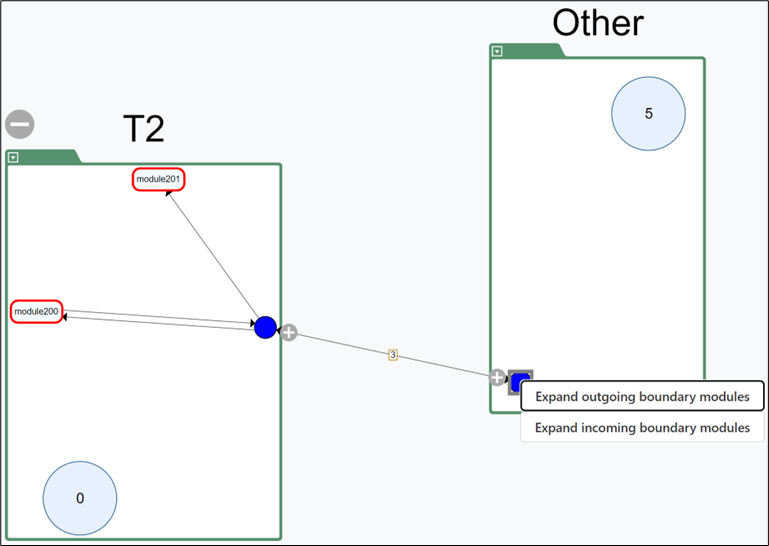
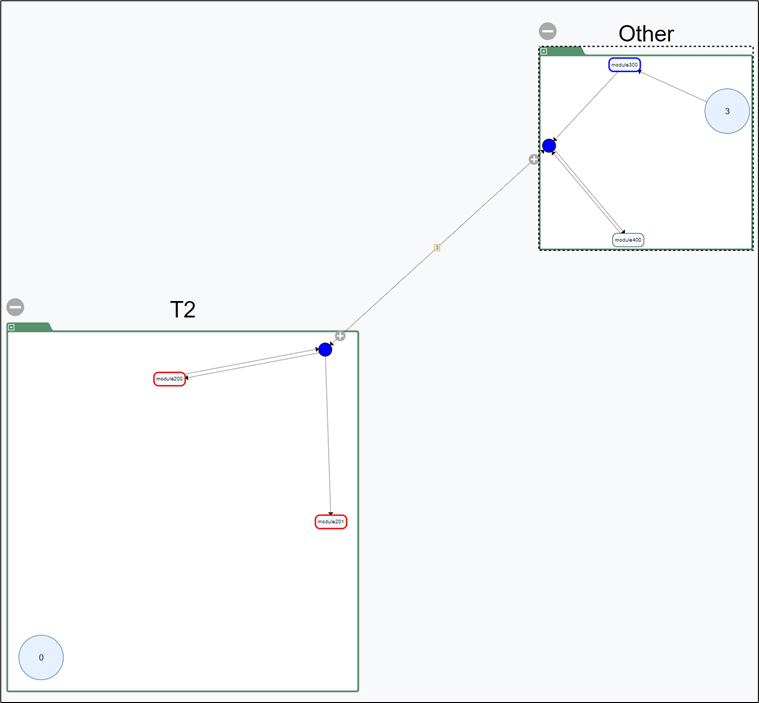
Step 5: Right-click an expanded module to use advanced options.
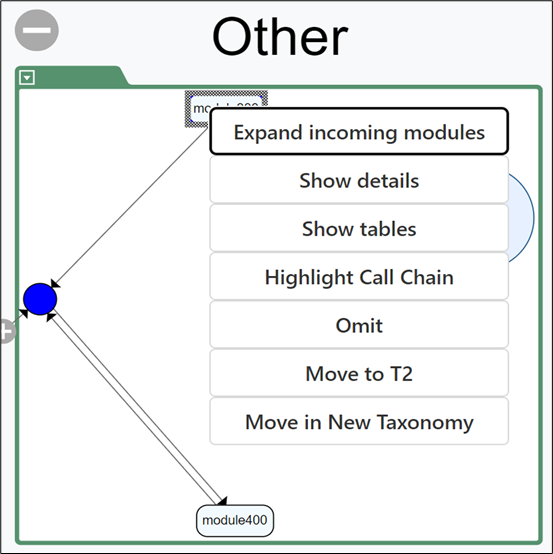
- Expand outgoing modules: expands outgoing dependencies.
- Expand incoming modules: expands incoming dependencies.
- Expand all modules: expands incoming and outgoing dependencies.
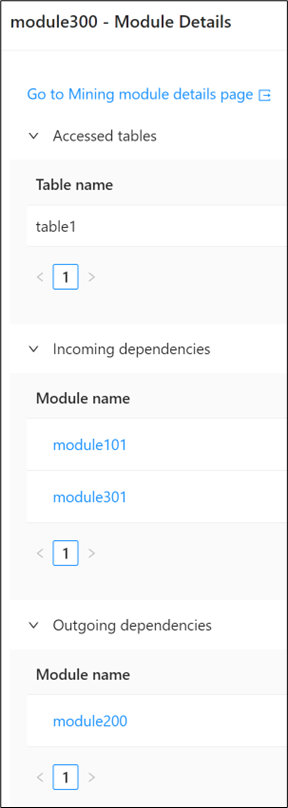
- Show Details: opens detailed module metadata and dependency information.
- Omit: temporarily removes the module and related lines.
- Move: moves the module to another context.
Step 6: You can also expand from unexpanded module-count circles by right-clicking a circle.
Step 7: Collapse an expanded context by clicking .
Adjust layout and clear highlights
Layout controls help you keep the graph readable as you refine context boundaries and run repeated searches. They are useful after expanding modules, moving ownership, or filtering the view several times in one session. Use these actions to reset the visual state before continuing your review.
Right-click empty graph space to open layout controls.
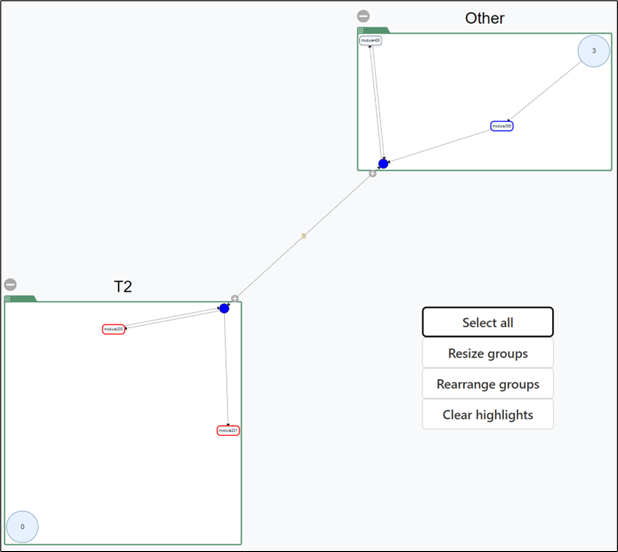
- Select all: selects all visible contexts.
- Resize groups: resizes displayed groups.
- Rearrange groups: rearranges contexts when edges overlap.
- Clear highlights: clears current search highlights.
After refining contexts in the graph, continue with BC Candidate Reports to review Candidate Edges, Connection Summary, and Access Pattern output.