Module Details
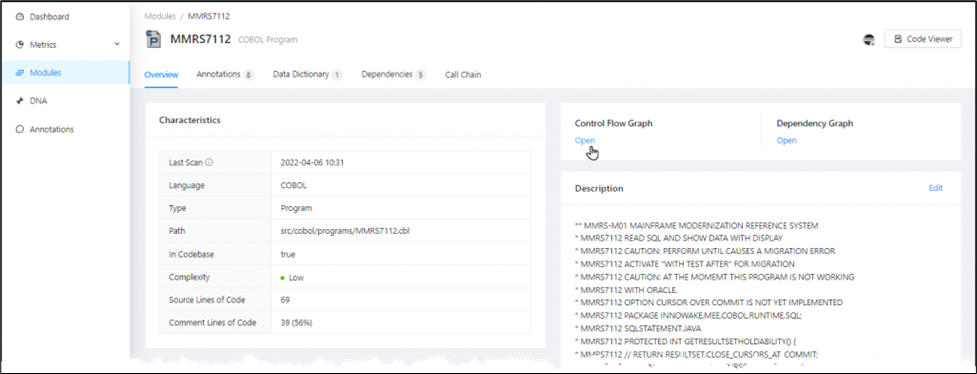
On the Modules page, click any Module Name in the table to display the corresponding mining data for that module on its Details page. This page centralizes the module's metrics, metadata, dependencies, and editing workflows in one place. Use it when you need a detailed view of a single artifact before moving into specialized tabs or visualizations.
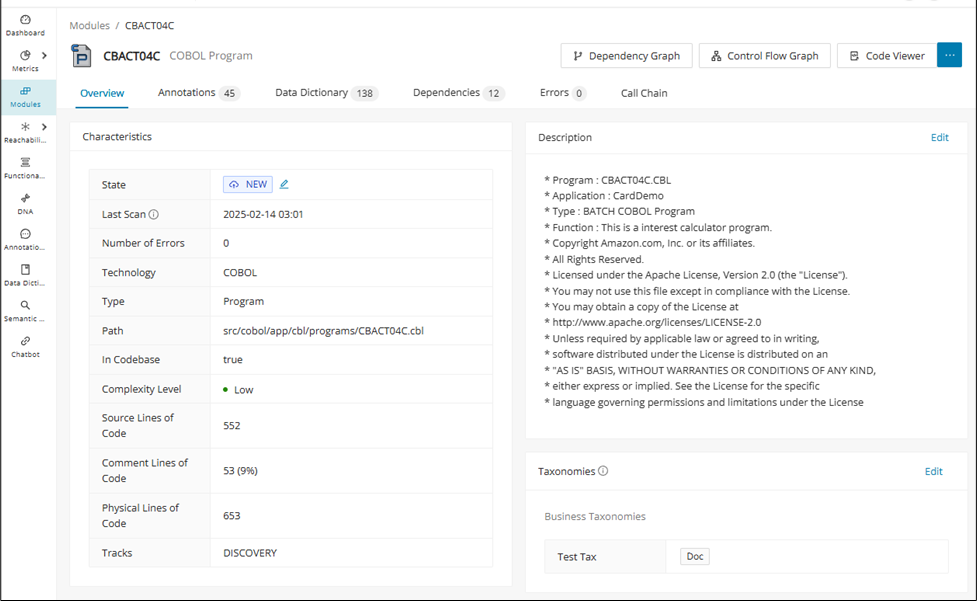
The following tabs are available to provide in-depth information about the selected Module:
| Contents | Description |
|---|---|
| Overview | The overview tab is divided into several panels: |
| Characteristics: Displays the characteristics of the module, such as state, language, type, path, whether the module is in the codebase, complexity, number of lines of code, and comment lines of code. | |
| Contained Module/Virtual Module: Indicates which virtual Modules are contained in the current one. If the current module is a virtual Module itself, the Virtual Module panel will display the Module that contains it instead. | |
Custom Properties: Allows for custom settings for Modules to fit the needs of each project. Click Edit Values to assign custom properties when none are assigned yet. For more information, see Custom Properties 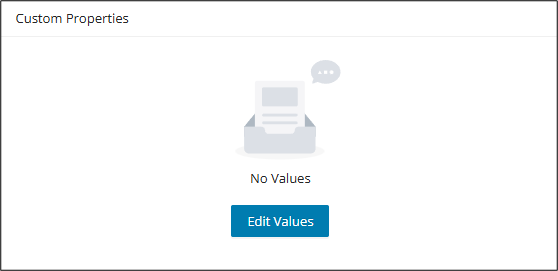 |
|
| DNA (if available): Visualizes the data gathered by the Discover DNA feature for each module belonging to the same cluster. | |
| Control Flow Graph: Allows you to visualize the Control Flow Graph. For more information, see Control Flow. | |
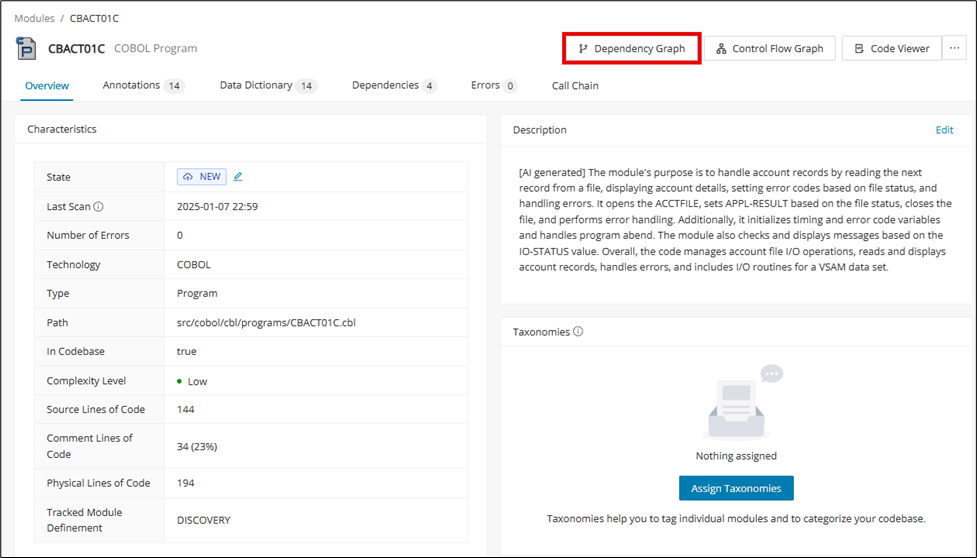
| Dependency Graph: Visualizes the Dependency Graph, see Dependency Graph View. | |
Description: Enables you to add or edit the description of the Module. Click the Edit link in the description card to open the 'Edit Module Description' dialog.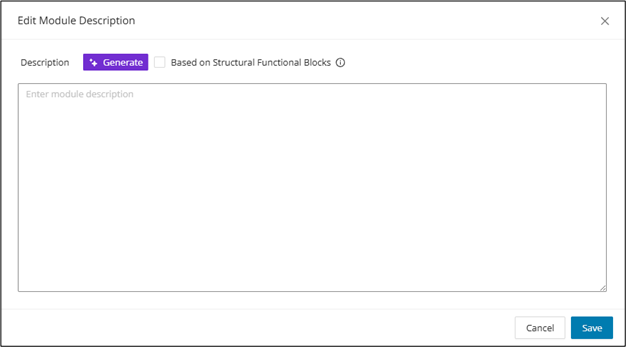 |
|
| Click Generate to populate the description text area with a Gen AI summary and check "Based on Structural Functional Blocks" if the description needs to be associated with the structural functional blocks. | |
| "Based on Structural Functional Blocks" only works for COBOL, and when used, existing structural functional block descriptions will be overwritten. | |
The feature toggle generativeAiTranslations must be enabled in the WebUI feature console. |
|
Taxonomies: The Taxonomies tab is only available if the project contains taxonomies. It displays all taxonomies assigned to this Module. Taxonomies can be directly assigned to the module by clicking Assign Taxonomies and selecting applicable values in the resulting overlay: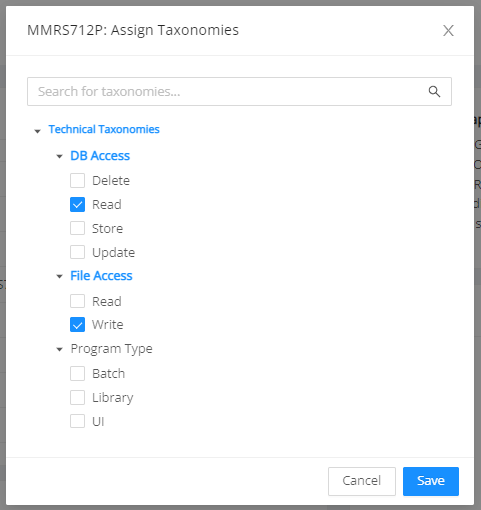 |
|
If taxonomies are already assigned, they can be edited or removed by clicking the Edit link: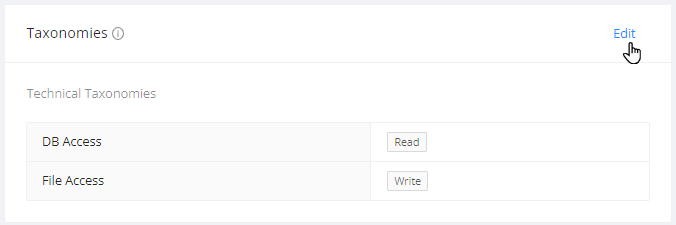 |
|
| Annotations | Lists and describes all assigned annotations for the selected module. The entries can be sorted and filtered by: Default Columns: - Annotation Type: Select a type from the drop-down menu - Category: Select a category from the drop-down menu - State: Select a state from the drop-down menu - Annotation Description: The description entered for this annotation - Source Code: The line(s) of code this annotation applies to - Modified By: The user who last updated the annotation - English Translation: The translation of the Source Code It is possible to customize the table by removing existing columns or adding other annotation-related columns to the table by clicking the settings icon on the right next to CSV . For example, it is possible to search, sort, or filter annotations by Business / Non-Business Variables Referenced, Process Sequence, Module Path, and Module Technology & Type. Each annotation entry can also be edited or deleted in an overlay window by clicking Edit on the far right of the table. A shortcut menu provides direct access to the Code Viewer for the corresponding module at the position of the selected annotation. Clicking CSV will download the table content in .csv format. |
| Data Dictionary | Lists all data dictionary entries for a module. It also includes data dictionary entries from the copy codes used. To filter by Field Name, start entering the first letters of the corresponding data element. - Module Name: Name of the module - Field Name: Displays the name of the field element - Field Type: Displays the field type - Field Description: Description of this field - Field Format: Displays the field format, for example, PICX or GROUP - Field Level: Level of this field - Group Field: Displays the group field - Length: Displays the number of characters in the data element name - Created By: The user who created the data element It is possible to customize the table by removing existing columns or adding other data dictionary-related columns to the table by clicking the settings icon on the right next to CSV . Clicking CSV will download the table content in .csv format. To learn more about conducting Field Level Mining from the Data Dictionary, access the Data Lineage page. |
| Dependencies | Lists all dependencies. You can filter by Target Name, Relationship Type, and Direction. To filter by target name, start entering the first letters of the corresponding dependency. - Target Name: Displays a list of target dependencies. - Relationship Type: The drop-down list can include the following types: CALLS, INCLUDES, READS_WRITES, REFERENCES. - Direction: The drop-down list offers the options IN and OUT. It is possible to customize the table by removing existing columns or adding other dependency-related columns to the table by clicking the settings icon on the right next to CSV . In the Dependencies tab, clicking Dependency Graph will open the Dependency Graph view. Clicking CSV will download the table content in .csv format. |
| Errors | Lists all related errors for the selected module. The table contains the following columns: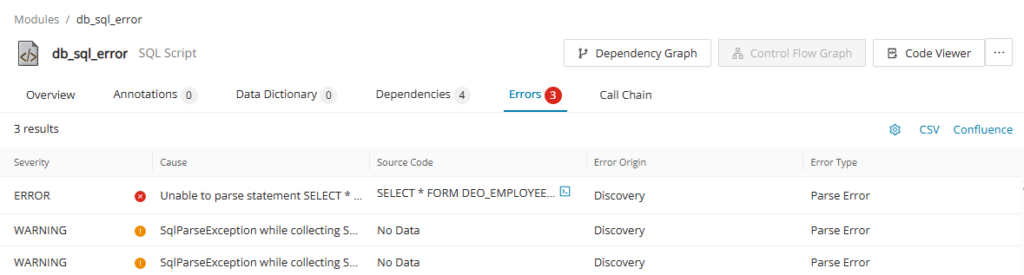 - Severity: Indicates the severity of the entry, whether it's an error or a warning. - Cause: Displays the error message and the cause of the error. - Source Code: If applicable, shows the source code where the error occurred. Click on to display a side panel "Marked Code" to see where the code has an error. 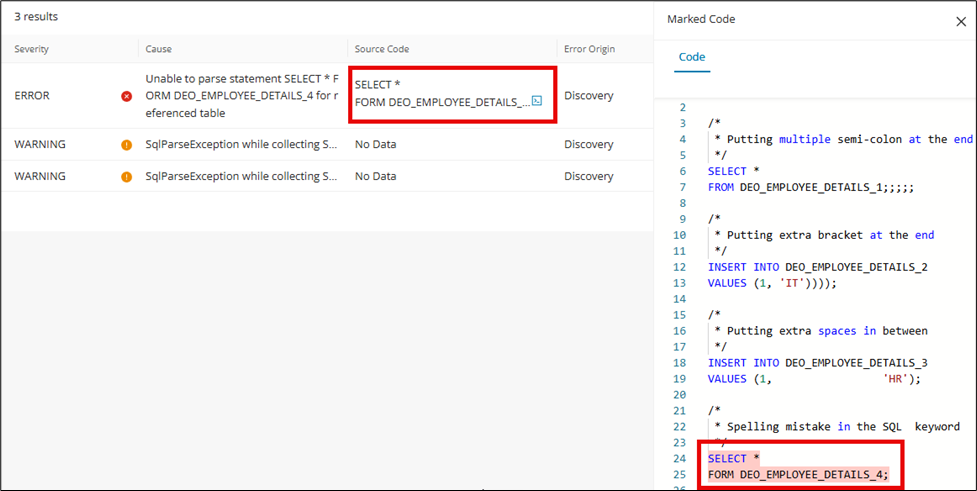 - Error Origin: Indicates the process in which the error occurred. - Error Type: Indicates the classification of the error: "parse error", "missing dependency", "internal error", etc. |
| Call Chain | Exports call chains in CSV with customizable properties for generating the call chain. See Call Chain for more information. |
Call Chain
The Call Chain feature allows you to analyze the in- and/or outbound sequence of modules and method calls referencing the currently selected module. The identified call chains are exported in .csv format with customizable properties for generating the call chain.
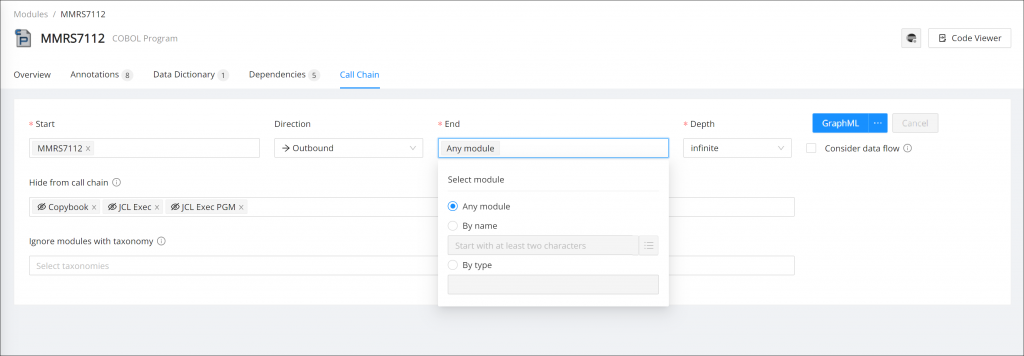
Call Chain has the following properties:
- Start: This field is filled out automatically with the Module on which you opened the Details page. This can be adjusted to any other module as the starting point of the call chain.
- Direction: This field determines whether inbound, outbound, or both modules are included in the call chain analysis.
- End: Mandatory. This field is filled out automatically with the default value "All Modules". This can be adjusted to any other module as the termination point of the call chain.
- Click the Start or End field to see the available options.
- All entry point modules/All Modules: The default entry for the End field. If the Start and/or the End field value is cleared, it is automatically populated with this option.
- By Name: Select this option to search for the modules by name. Select the input field to display a list of the available modules. You can select any number of names in the list.
- By Type: Select this option to search for the modules by type. Click in the By Type field to display a list of all available types. You can select any number of types in the list. Selecting a combination of modules from the options By Name and By Type is also possible, for example, to generate the call chain between a specific module and all BMS Map programs.
- Depth: Select the depth of the call chain. By default, Depth is set to "infinite".
- Format: Select your desired export format (GraphML, CSV, ZIP, or CSV)
- Hide from call chain: Optional. By default, the types "COBOL Copybook", "JCL Exec", and "JCL Exec PGM" are hidden from the call chain export. Click in the Hide from Call Chain field to display a list of all available types. You can select any number of types to exclude from the call chain results.
- Ignore modules with taxonomy: Optional. This field allows you to select any of the available taxonomies in your project. If a module with a selected taxonomy is detected in the call chain analysis, the module itself will be included in the call chain, but its subsequent in- and outbound dependencies will be omitted.
Edit inserted modules
After selecting the modules in the start/end field, click Edit Selection to open the "Insert Module List" dialog. To remove the already inserted modules from the "Insert Module List" dialog, click the at the end of the selected row of modules.
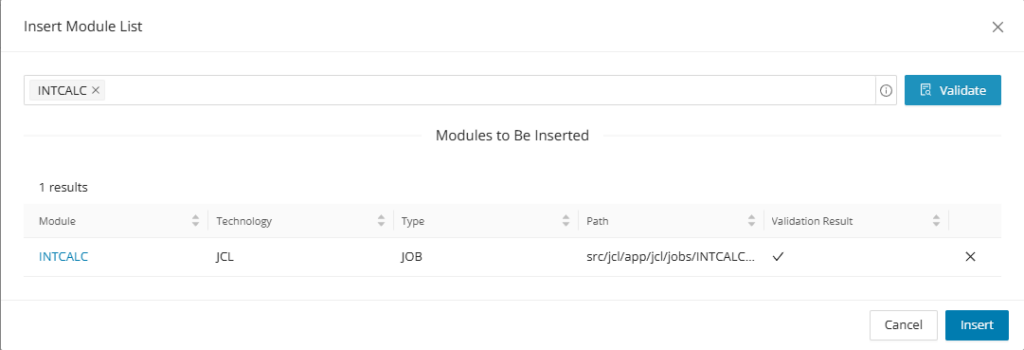
After removing the desired module/s from the list click Insert and the start/end field will be updated to the reduced module count.
Call Chain visualization
Hone the Call Chain options to your liking and click Render Graph to produce the Call Chain Visualization.
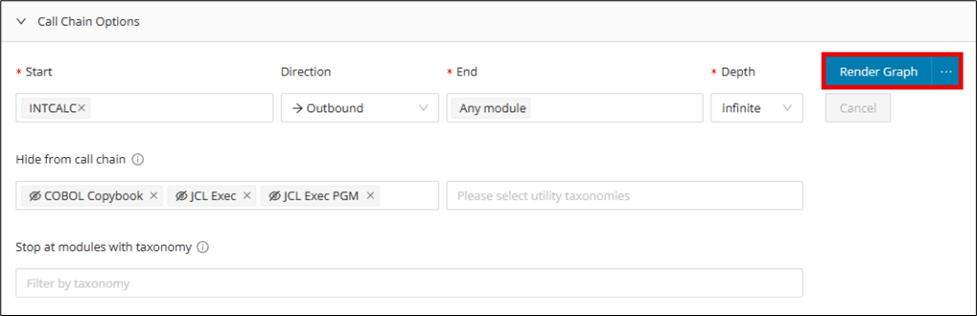
The visualization of the call chain can prove to be useful in understanding the in- and/or outbound sequence of modules and method calls.
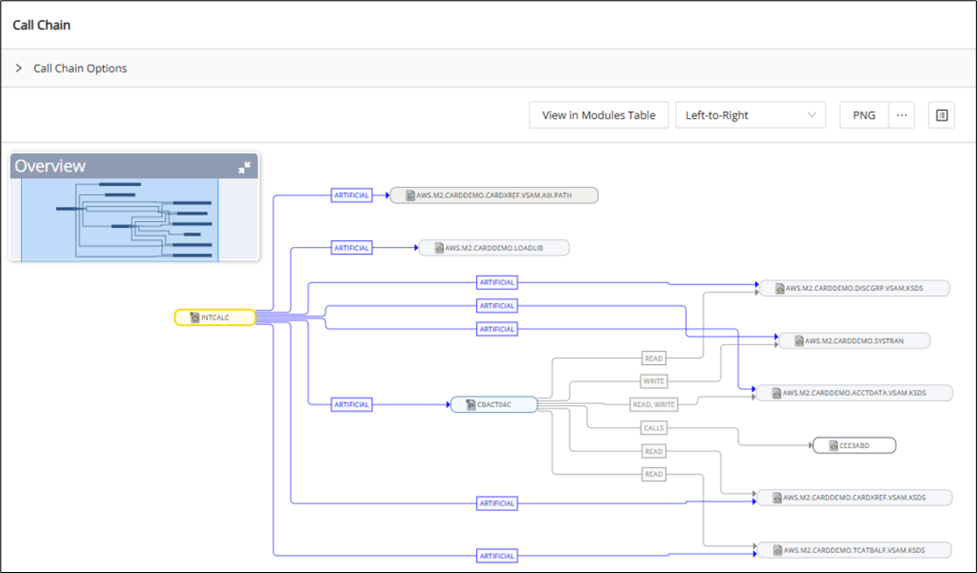
Manipulate the call chain visualization with the following features:
- View in Modules Table: Open a tab to the included Modules Table
- Visualization Layout: Select from a drop-down menu to change the layout of the visualization 1. Hierarchical 2. Left-to-right 3. Organic 4. Balloon 5. Radial 6. Cyclic
- Export: Export the call chain visualization as a PNG, GraphML, PDF, or SVG
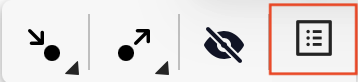
- Toggle Side Panel: Toggle on or off to open an informative side panel to find more details on any node or edge. The side panel for nodes gives the option to Open Control Flow, Open Dependency Graph, Open Code Viewer, or Open Module Details for the selection.
Artificial edges
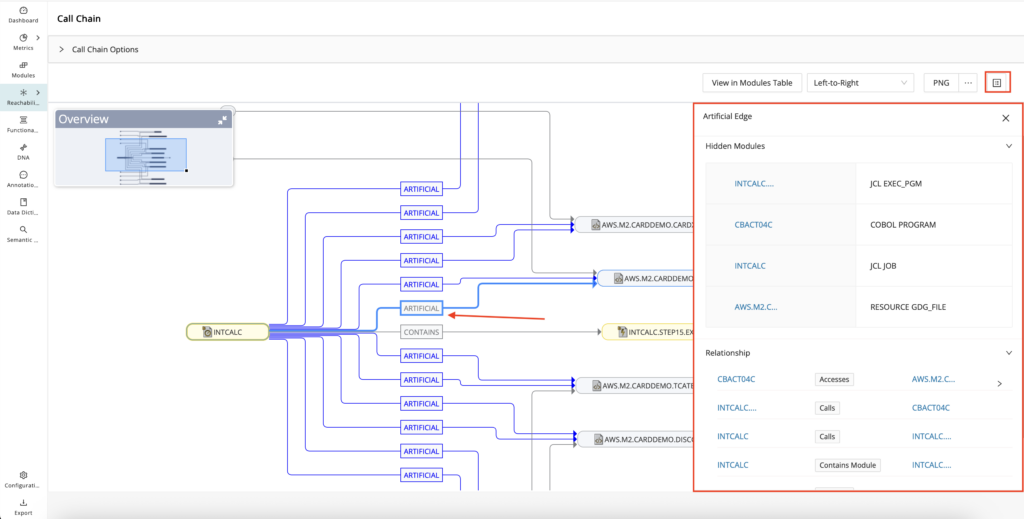
Artificial Edges are used to condense the graph when certain modules with specific Technologies, Types, Utility Taxonomy assigned, or Dependency Relationships are filtered/hidden. Edges represent the dependency connection between two module nodes on the graph. These edges in dark blue signal that there are modules and/or additional edges between one module node and another; however, they were manually hidden versus other modules displayed along the graph.
Creating artificial edges
Expand the Call Chain Options dropdown, and in the "Hide from call chain" field, there are several default types set to be hidden by default, including COBOL Copybook, JCL Exec, and JCL Exec PGM. These will automatically create artificial edges on the graph when these types of modules are encountered; however, you can add additional technologies, types, or modules assigned utility taxonomies you would like to be hidden and shown only as part of an artificial edge. To remove artificial edges, simply remove associated unwanted selections from the "Hide from call chain" field.

Info
Artificial edges are rendered from both the Call Chain and Dependency Graph, where you can filter technologies, types, edges, and modules with utility taxonomy assignments.
Shared Module Details side panel
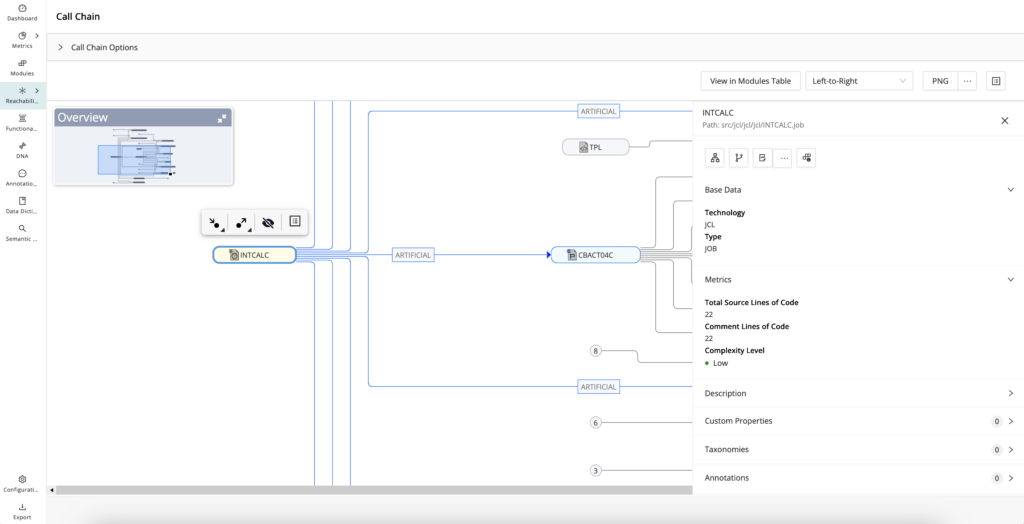
From the Call Chain Graph, click on your module node of interest and click on the side panel icon.
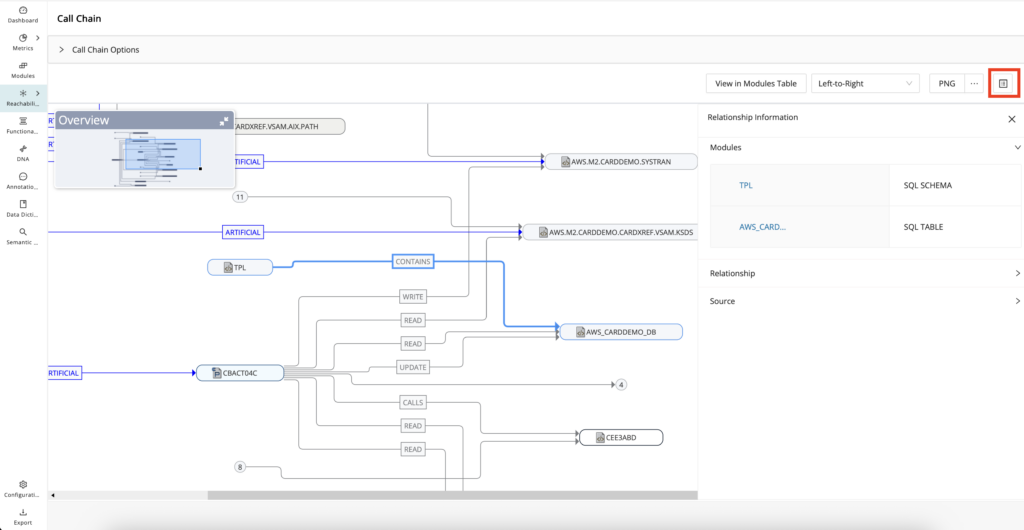
Edge side panel
From the Call Chain Graph, click on the edge representing the dependency relationship between two modules (includes artificial edges) and click the side panel icon on the top right next to the PNG export button.
Dependency Graph
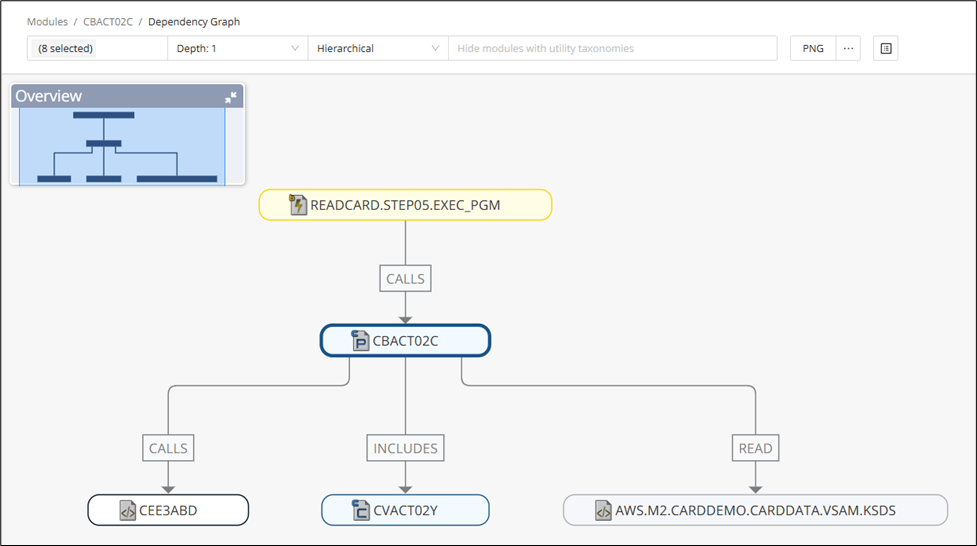
The Dependency Graph view uses yFiles for visualizing application dependencies. yFiles is a library for the visualization and automatic layout of graph structures.
To display the graph from the Module Details, click Dependency Graph .
The Dependency Graph view allows you to filter the dependencies displayed, set the display depth, and select the layout style used. At the top of the view, three drop-down lists provide filtering options for the graph. The titles of the drop-down lists are updated to reflect your filtering selections. To save the Dependency Graph, select the desired format from the menu on the top right of the view. You can choose from PNG, PDF, SVG, or GraphML.
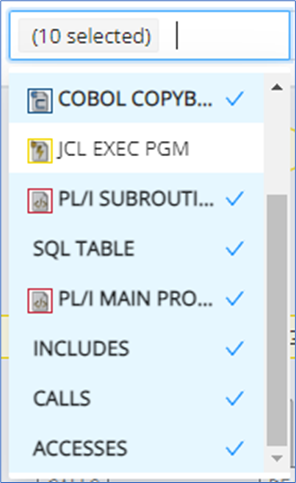
Drop-down list for selected
This filter allows you to select the items to display. The title of the drop-down list displays the number of items selected, for example, "7 selected". If you filter nodes that have a transitive dependency, the edges will be merged into one new edge so that the dependency to the transitive referenced node is still displayed.
Info
A transitive dependency is an indirect functional dependency, that is, any dependency that is induced by the components that the program references directly. For example, a call to a log() function will usually induce a transitive dependency on a library that manages the I/O to write the log message in a file.
From the drop-down list, deselect the nodes that you wish to omit. (In our example, it is JCL EXEC PGM.) Subsequently, the deselected nodes are displayed in white.
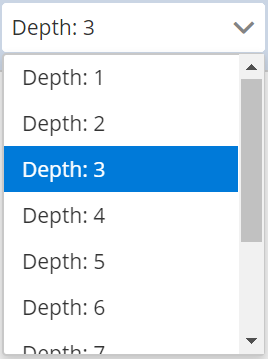
Depth: < > drop-down list
Allows you to select the depth (level) of the dependencies displayed. Depth range: 1 - 10.
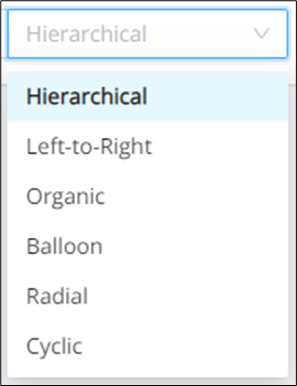
Hierarchical drop-down list
Allows you to visualize the hierarchy with the following layout styles: Hierarchical (default), Left-to-Right, Organic, Balloon, Radial, and Cyclic. The layout style selected is displayed as the title of the drop-down list.
Filtering the edges of nodes
An edge filtering feature allows users to selectively enhance the depth for specific nodes without having to change the depth for the entire dependency graph. Simply click a node to display a context menu, which allows you to select/deselect the edges you wish to display. For example, you can display only the outgoing or incoming calls for a node.
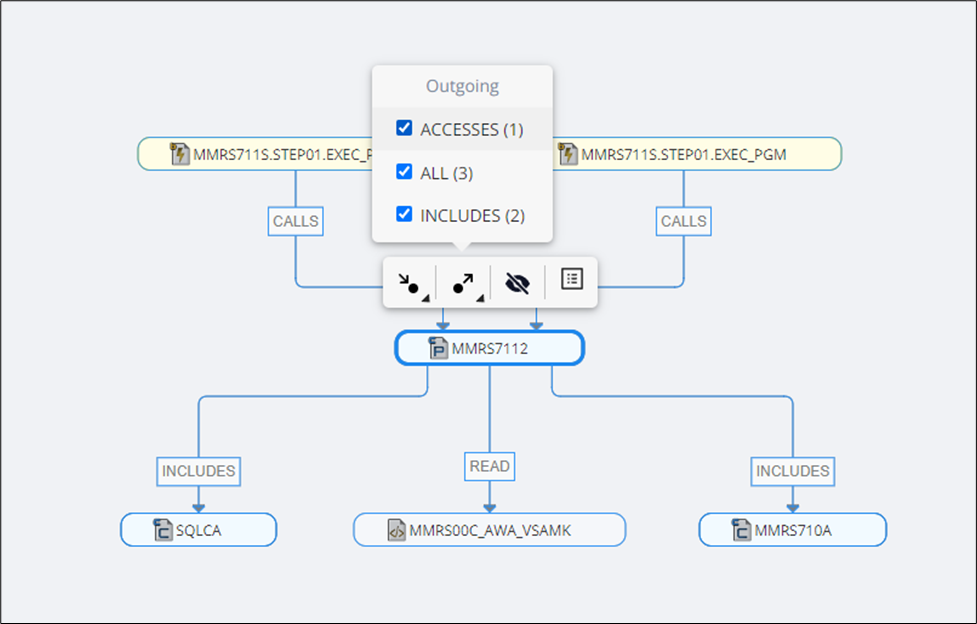
This feature makes working with the dependency graph more productive, and users can focus on areas of interest on the graph.
| Icon | Description |
|---|---|
| Clicking a node and selecting the Incoming Edges icon from the context menu will display a list of nodes that can be deselected. If the selected node has no incoming edges, the message "There are no incoming edges for this node" will be displayed. | |
| Clicking a node and selecting the Outgoing Edges icon from the context menu will display a list of nodes that can be deselected. If the selected node has no outgoing edges, the message "There are no outgoing edges for this node" will be displayed. | |
| To hide a node, click the Hide Node icon. Root nodes cannot be hidden. If you click a root node and select the Hide Node icon from the context menu, the message "Root node cannot be hidden" will be displayed. | |
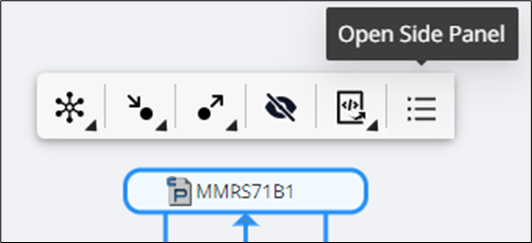
| Select Open Side Panel to open the side panel for the selected module. |
Toggle side panel
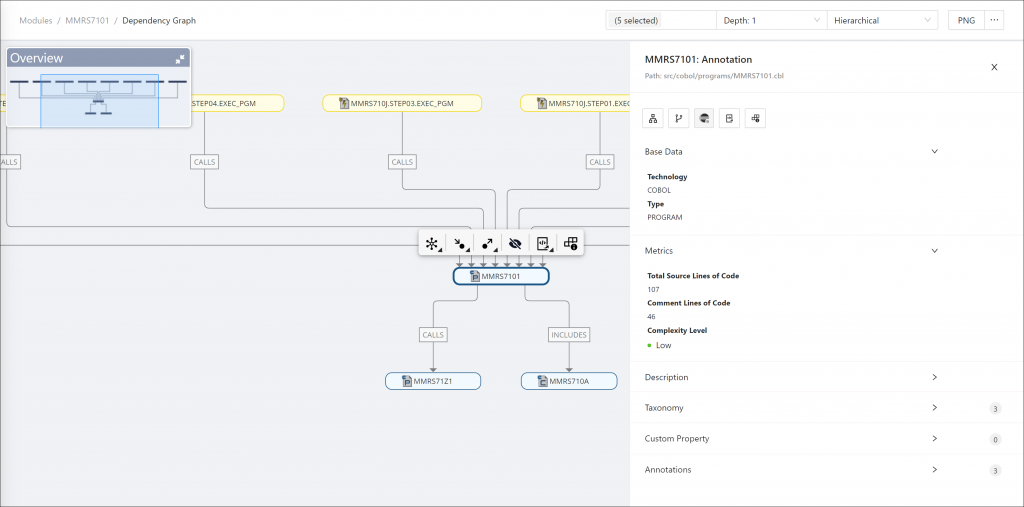
When Toggle Side Panel is selected, the side panel will open and stay open. When the user switches between edge and module information, the side panel will be dynamic and change information based on what is selected.
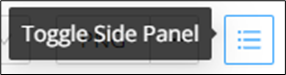
Another way of opening the side panel is by clicking the module and selecting Open Side Panel from the context menu displayed.
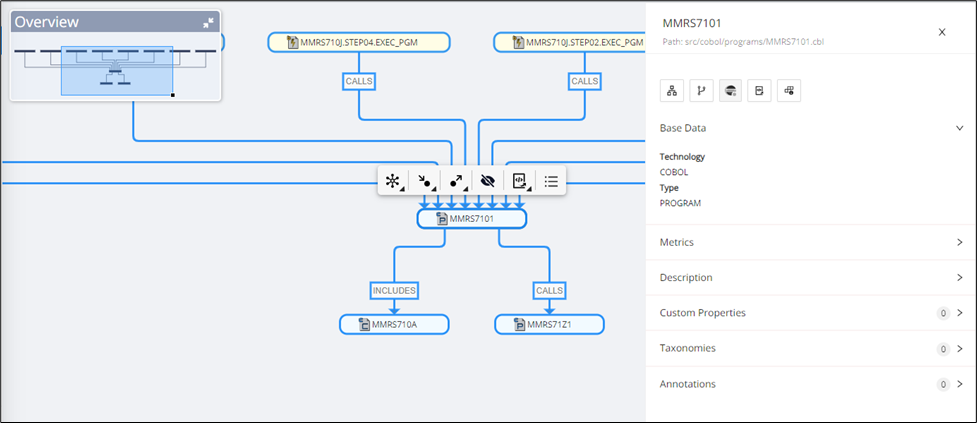
The side panel of the selected modules displays the module name, path, base data consisting of technology and type, metrics, description, custom properties, taxonomies, and annotation.
| Icon | Description |
|---|---|
| Open Control Flow | |
| Open Dependency Graph | |
| Open Code Viewer to open and review the selected module's source code | |
| Extends Open Code Viewer with options to view Single or Assembled Module View | |
| Open Module Details |
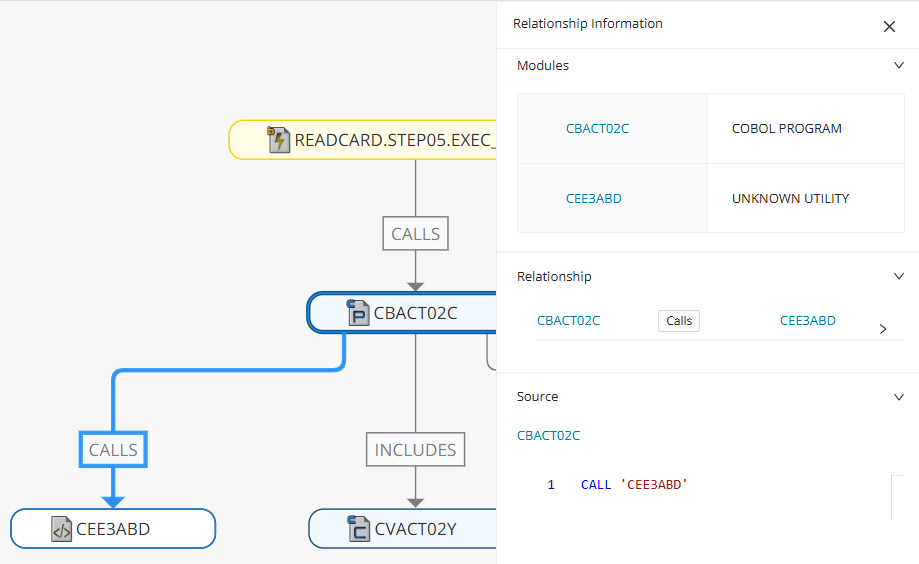
The edge side panel displays the relationship information, such as modules, relationships, and source code, when the edge is clicked.
| Edge Side Panel Information | Description |
|---|---|
| Modules | Shows the two modules of the edge and their associated technology and type of file |
| Relationship | Shows the specific interaction or dependency type between two modules |
| Source | Shows the source code of the edge |
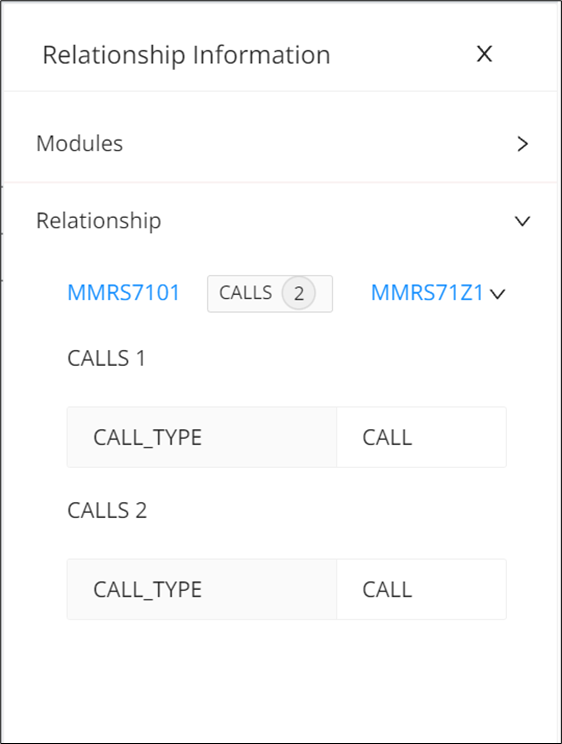
The relationship information will also display all of the relationships between two modules, for example, if a module calls another module multiple times.
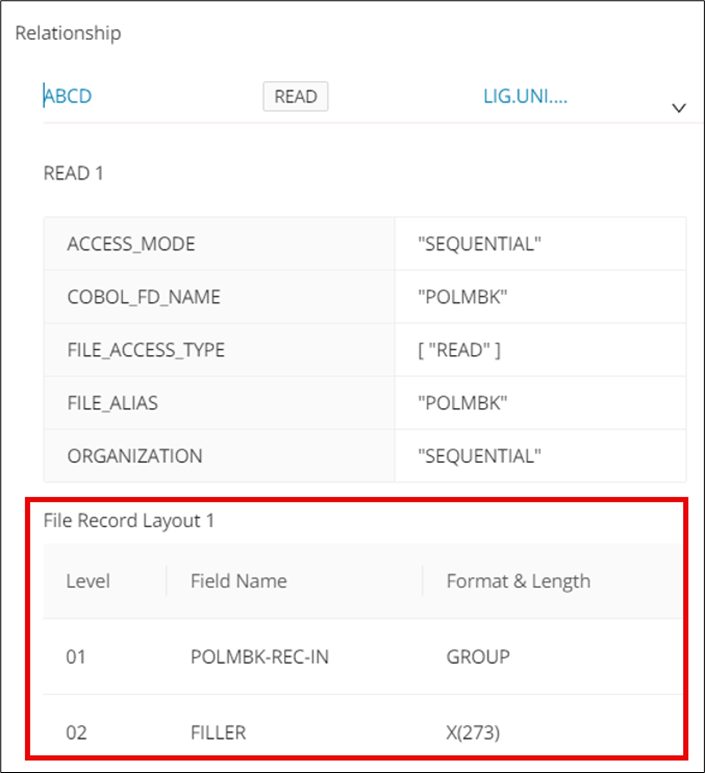
File record layout
The edge side panel also includes a feature called "File Record Layout," which details how the data in the file is structured (extracted from the COBOL module) for access type details. Also, there can be multiple file record layouts on the same file based on the different modules accessing it.
Shared Module Details UI component
Info
This feature is available not only from the Dependency Graph but other graphs as well including the Call Chain, Data Lineage, and Reachability Details Graphs.
The shared module details component provides quick access to module details wherever you are in the UI, without the need to navigate back to the Module Details page. Clicking a module reference, that is, a node in the dependency graph, will open a dialog showing all relevant module details.
Control Flow Graph
You can visualize the executable control flow of a program in a graph, and for COBOL, you can extend this to see the control flow beyond your program to visualize called programs within the context of the same graph. To calculate and view the control flow graph, click Open in the Control Flow Graph card.
Info
This feature fully supports C, COBOL, JCL, Natural, and PL/I, and has partial support for Java.
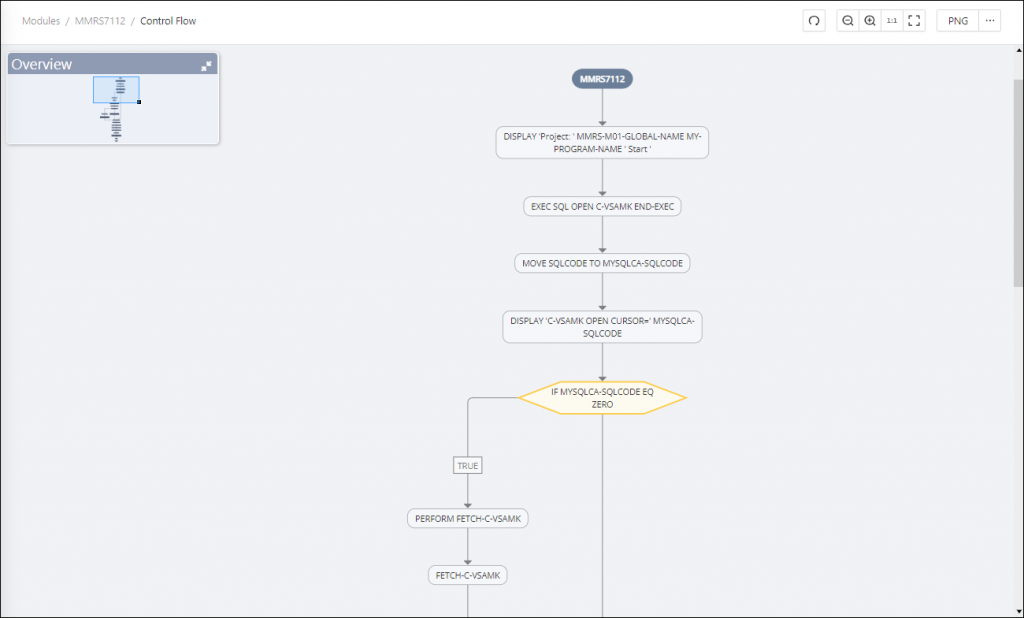
The nodes in the graph have the following meaning:
- Circles represent the entry and exit points of the program.
- Rectangles represent executable action statements.
- Rhombuses represent conditional statements.
A 20-character limit is applied to the texts in each node. If the text exceeds that limit, it will be truncated with three dots (...). Edges of conditions are labeled with true or false.
Toolbar actions
The toolbar contains icons for resizing the contents and options for saving the graph:
| Icon | Description |
|---|---|
| Click the Recalculate icon to reset the graph to its original state. | |
| To zoom out of the control flow graph, click the magnifying glass with the minus sign. | |
| To zoom in on the control flow graph, click the magnifying glass with the plus sign. | |
| Click 1:1 to zoom to the original size. | |
| Click the Fit Content icon to resize the control flow graph to fit the window. | |
| To save the control flow graph, select the desired format from the drop-down menu. You can choose from PNG, PDF, SVG or GraphML. |
The Control Flow Graph page displays an error message if the calculation of the control flow graph failed and no content was generated. The error message contains a link that opens the Error tab on the Module Details page.
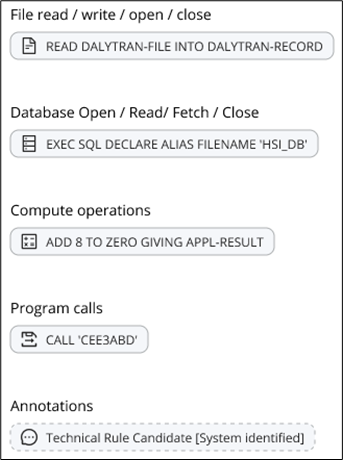
Core operations icons for Cobol programs
The control flow for Cobol programs provides the following icons next to the nodes that signal core underlying operations to quickly identify nodes of significance on the graph.
| Icon | Core Operation |
|---|---|
| File Read / Write / Open / Close | |
| Database Open / Read / Fetch / Close | |
| Compute Operations | |
| Program Calls | |
| Annotations |
Collapsible Control Flow graph
Info
This feature is currently available for COBOL only.
Sections, paragraphs, and branches of the control flow graph are grouped in expandable panels that are collapsed by default. Each panel can contain additional expandable panels, depending on the complexity of the grouped element.
Select the and icons in the block's top right corner to expand or collapse the panel, respectively. To expand all panels at once, click Expand groups in the top menu bar. To collapse all panels at once, click Collapse groups in the top menu bar.
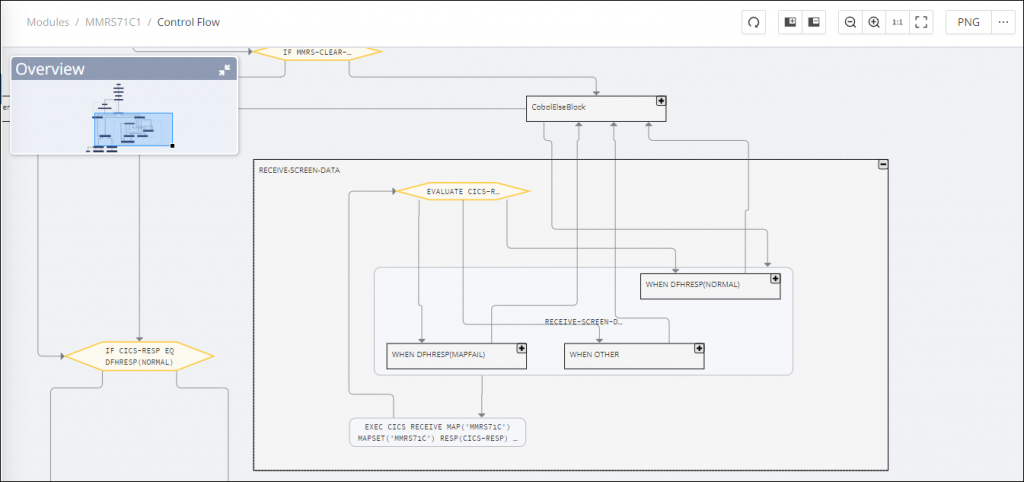
There is no collapsible control graph for a group node that contains only a single node. In this case, only the child node will appear instead of the parent node.
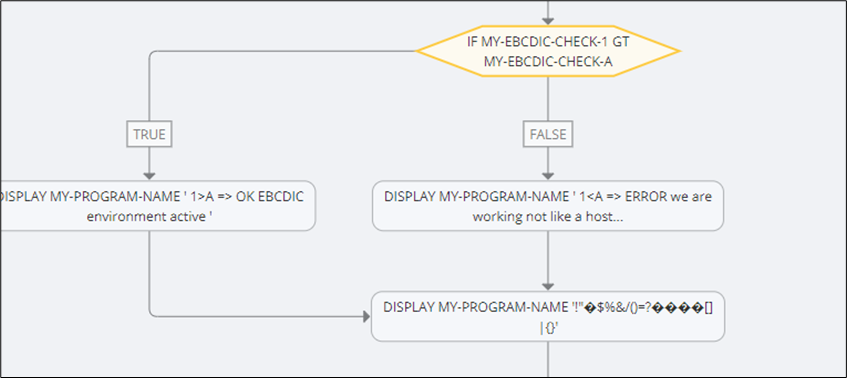
Expanding the Control Flow graph
Info
This feature is currently available for COBOL only.
Call statement nodes that transfer executable control to an external module can also be loaded and then expanded/clicked to generate and visualize the control flow for the external module as well.
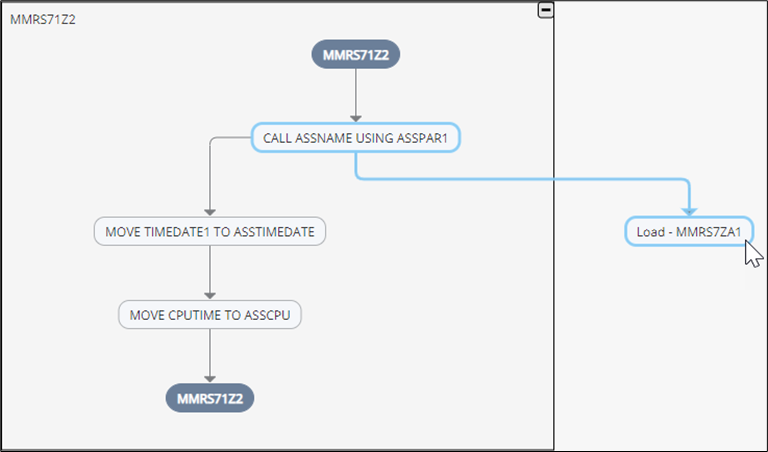
Highlighting the Control Flow graph
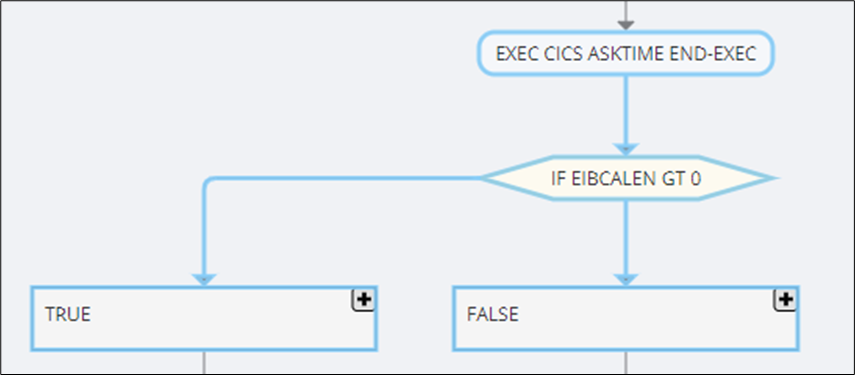
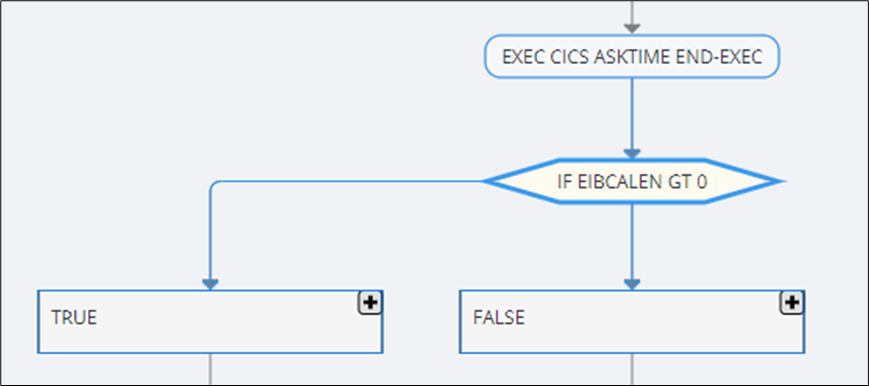
Hovering the cursor over or clicking any node in the control flow graph highlights other nodes that are connected to the clicked node. Hovering over a node will highlight the nodes in light blue, and clicking a node will highlight the nodes in dark blue. Clicking outside the graph will remove the previous highlighting of the nodes.
Source code panel
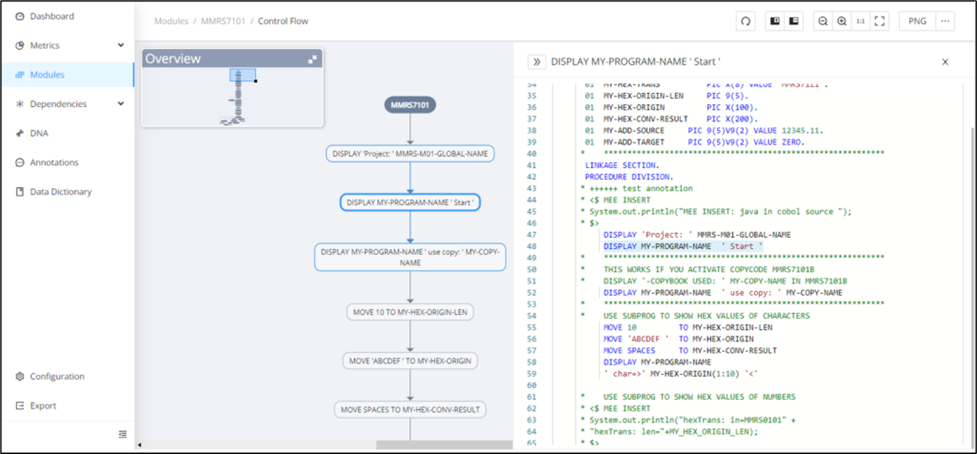
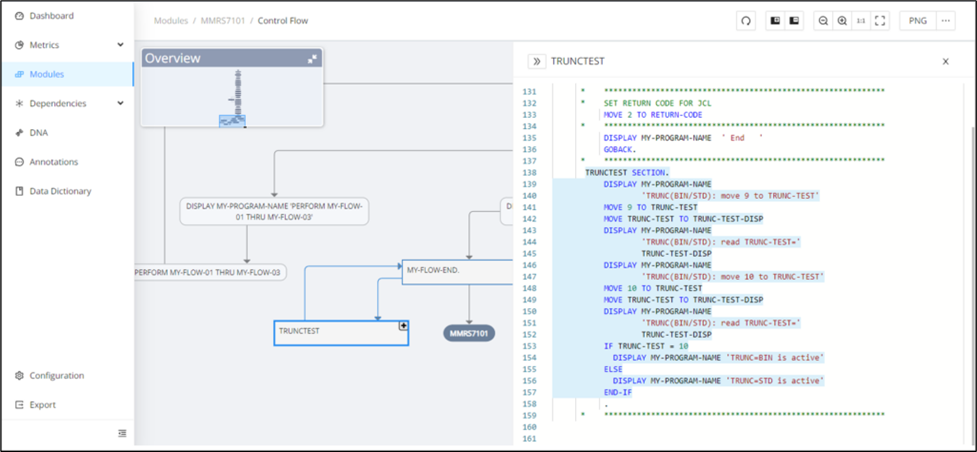
Some modules have a large control flow graph, and the order of the nodes can be confusing at times. For this reason, when you click any node in the control flow graph, the source code is displayed in the pane to the right of the graph, with the specific source code of the clicked node highlighted with the line position.
Clicking the node with the module name (for example, "MMRS7101") displays the whole source code. The name of the clicked node is also displayed as a header in the source code.
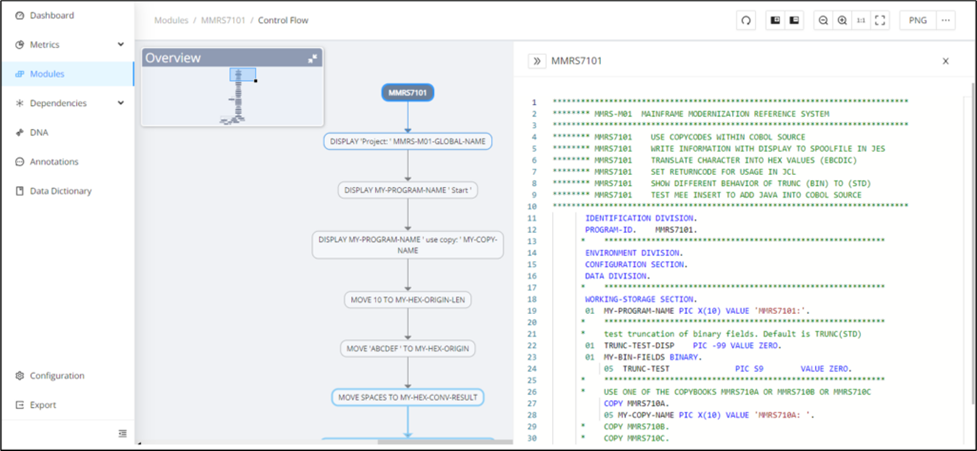
Clicking a specific node displays the source code in such a way that the code associated with the node is highlighted together with the corresponding header and line position.
Clicking a collapsed group node displays the source code in such a way that all lines of code within the selected group node are highlighted.
Highlight Annotations
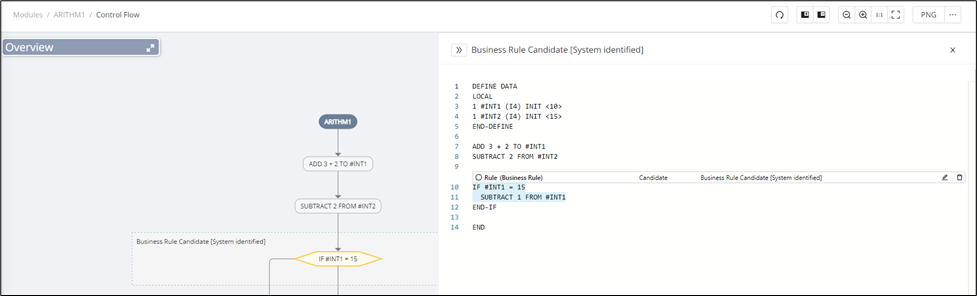
This feature highlights the annotations to distinguish the unique execution path for modules with identified business rules on the Control Flow Graph page.
The Control Flow Graph for the module with identified business rules will be displayed as "Business Rule Candidate [System identified]" as a separate AST node in a blue dashed border with a expand icon at the top right corner of the node.
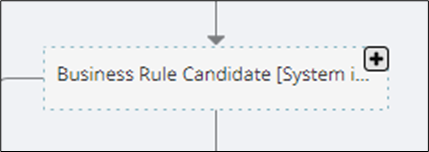
Click to expand the node and display a side panel highlighting the annotation's source code.
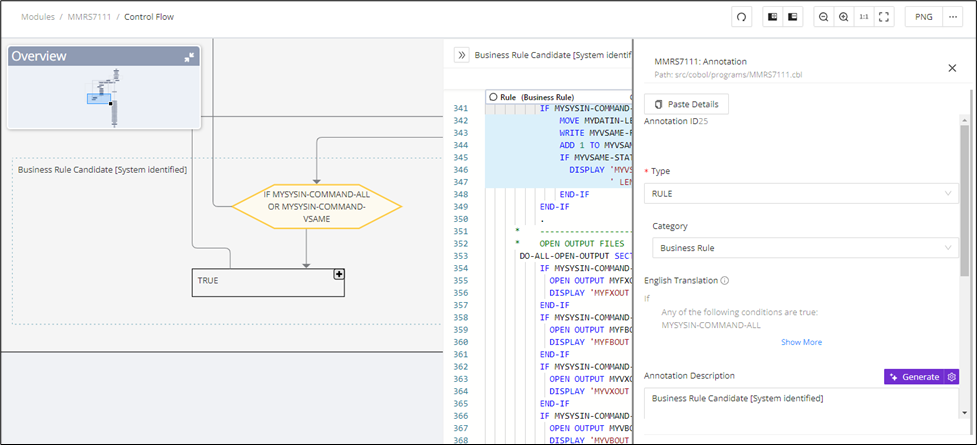
In addition, the Annotation editor contains a Control Flow graph that redirects to the Control Flow Graph page zoomed to the selected annotation.
The source code tab should contain both the annotation block and the annotation node. To access the annotation block, click the node for the source code tab. The annotation block can be edited and deleted as needed, and the same will be reflected in the control flow graph. Click Edit to display the annotation editor and edit the type, category, annotation description, and state of the annotation.
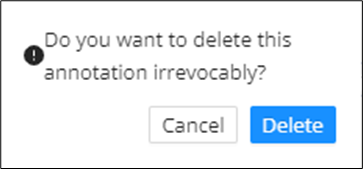
If needed, click Delete to completely remove the annotation from the source code.
Control Flow process grouping
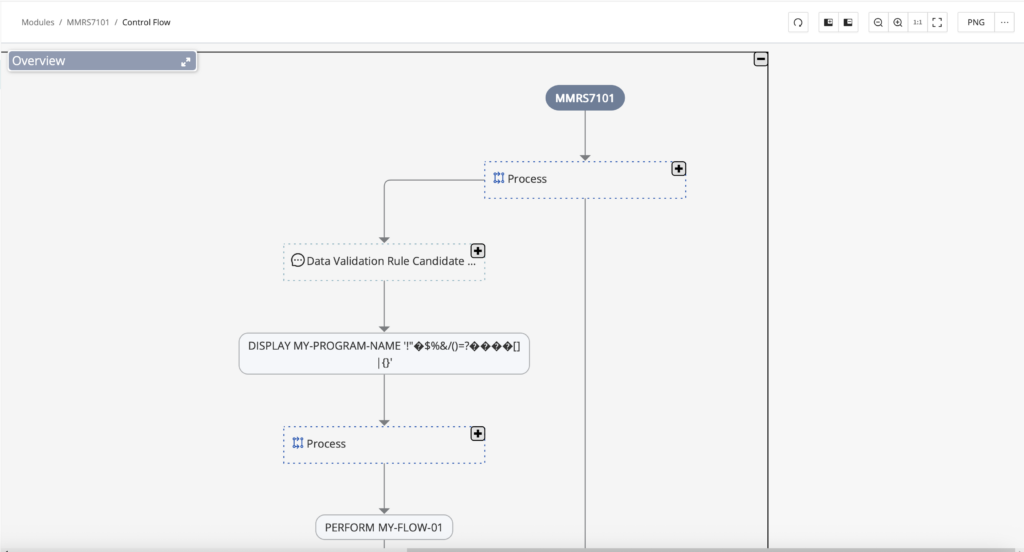
For sequential statements that do not branch or jump to other parts of the program, they are grouped into what's called a process to further abstract the graph and reduce the visual clutter so that you can see as much of the bigger picture of the overall flow of the program by default, and dig into the details as needed.
Info
This feature is currently available for COBOL only.
Code Viewer
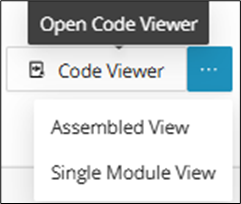
The module code can be reviewed by clicking Code Viewer in the top right corner (opens Assembled View by default). Hovering over the three dots gives the option to view in Single Module View or Assembled View. The Code Viewer also offers Annotation and Data Dictionary editing in the Web UI. For those workflows, see Code Viewer.
Custom module table state
After switching between tabs on the Module Details page, the customizable state of the filters, sorting, and columns remains the same. This persistent state makes it easier to compare related information across tabs without rebuilding the same table view. Use it when you want filters and visible columns to carry over as you move between module details tabs.
Example:
Choose a Module and click it, and that will navigate to the Annotation Tab. Created Annotations are displayed, after that, customize the state of the Tab:
- Filter Annotations Type with DATABASE and State with CANDIDATE;
- Click the settings icon and add a Path column.
- After that, click the Data Dictionary Tab.
The filters and columns remain the same.

Info
After refreshing the page, the state changes to default.