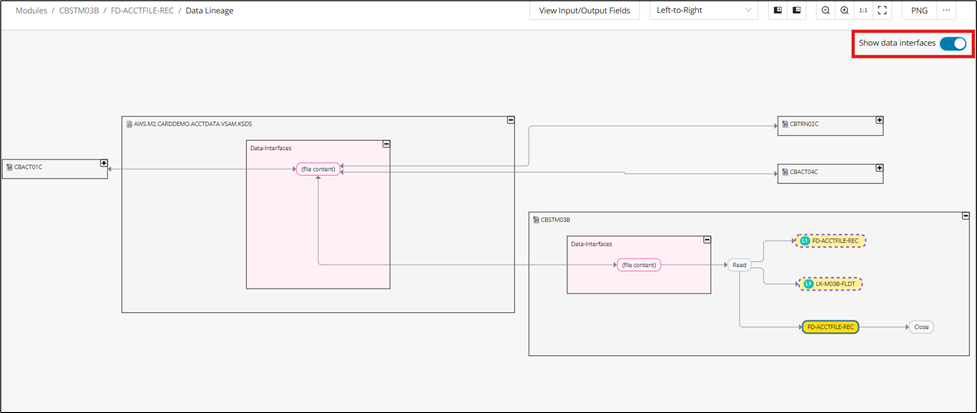
Data Lineage
Data Lineage provides insights into the data flow of an application to address key modernization challenges (data migration, impact, and compliance). This feature traces the data flow of your selected data entity (for example, variable, table column, etc.), and allows you to easily answer questions such as "If I remove a SQL Table column, which programs throughout my application would be affected?" or "How is the data consumed throughout my application from a resource file?".
Info
Only Cobol and SQL are supported for Data Lineage.
Data Lineage visualization
Data Lineage visualization shows how selected fields and statements connect across modules and interfaces. The graph views help you move from a single field reference to a broader understanding of upstream and downstream impact. Use the subsections below to open the visualization from the two main entry points.
Graph visualization from CodeViewer
Please follow the following steps to view the Data Lineage graph for a variable from the Code Viewer:
-
Place the cursor on a variable (either where it is declared or referenced in code).
-
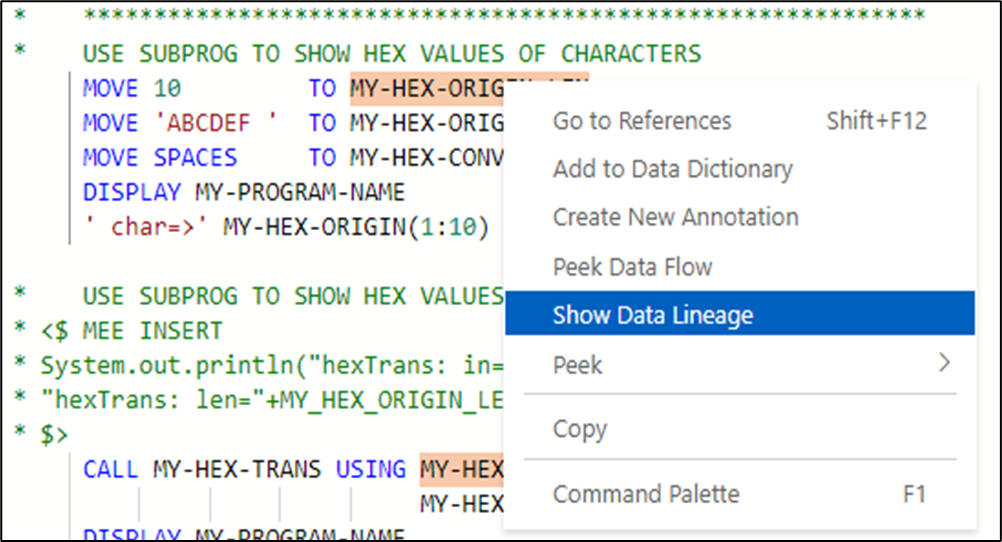
Right-click and select the Show Data Lineage option from the context menu.
-
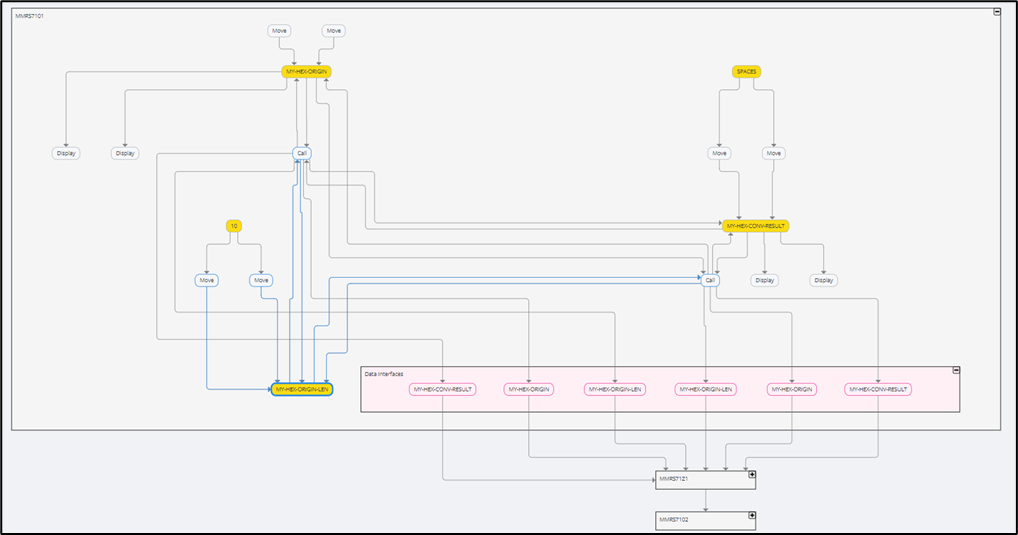
User is directed to a new tab with a scrollable graph (horizontal/vertical) for its data lineage.
-
The graph can be zoomed in and out using the two magnifier buttons displayed at the top right corner of the page.
-
Nodes of one module are grouped.
-
The graph will display only the immediate upstream (including all the data flow that enters the selected field via related fields) and downstream data flow from the selected field.
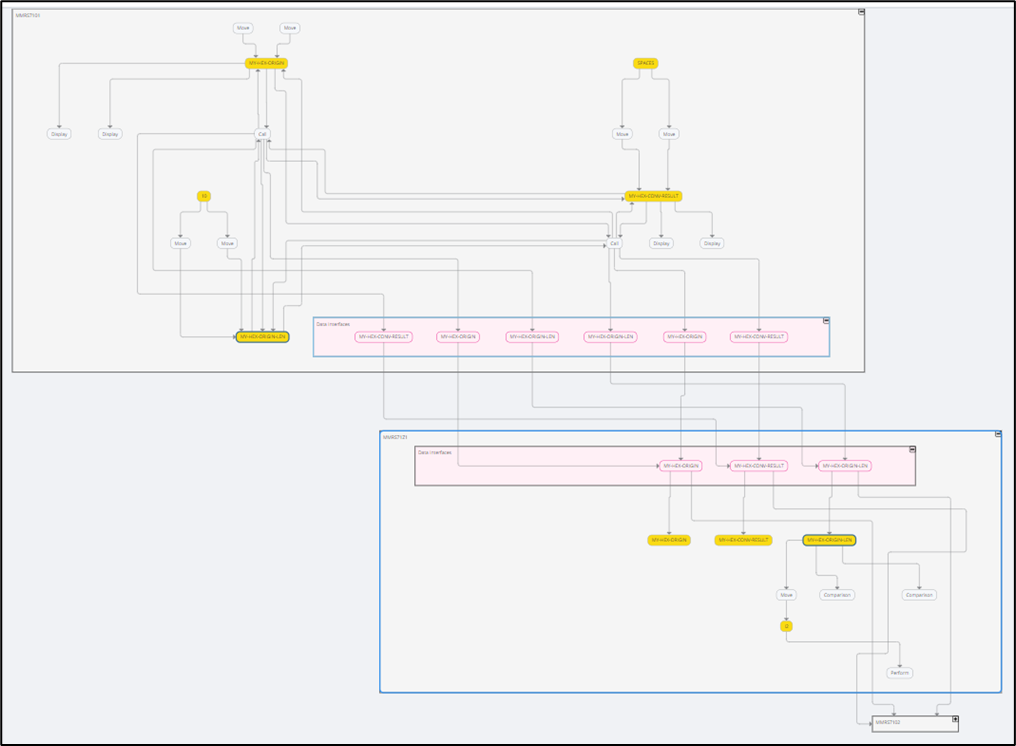
- Clicking the icon of a module node will display the internal intra-module data flow of the module.
-
Statements, Fields, and Data Interfaces in the graph are differentiated by color coding:
-
Statements: white
-
Fields: yellow
-
Data Interfaces: pink
-
Info
Data interfaces are the gateways for data flow between modules. They show exactly how each data element comes into a module or leaves a module, going elsewhere across the codebase.
Graph visualization from the Data Dictionary
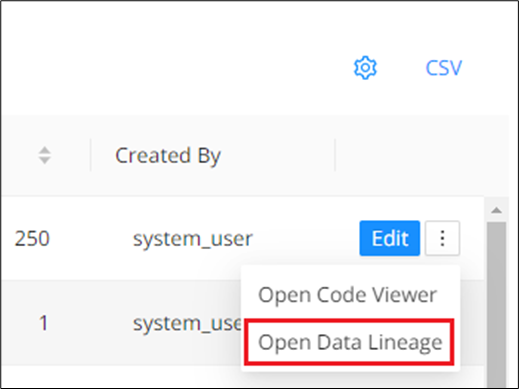
To trigger Data Lineage on any supported Data Dictionary entry, click on the menu icon of the Data Dictionary entry and select the "Open Data Lineage" option.
The Data Lineage graph will be displayed in a new tab.
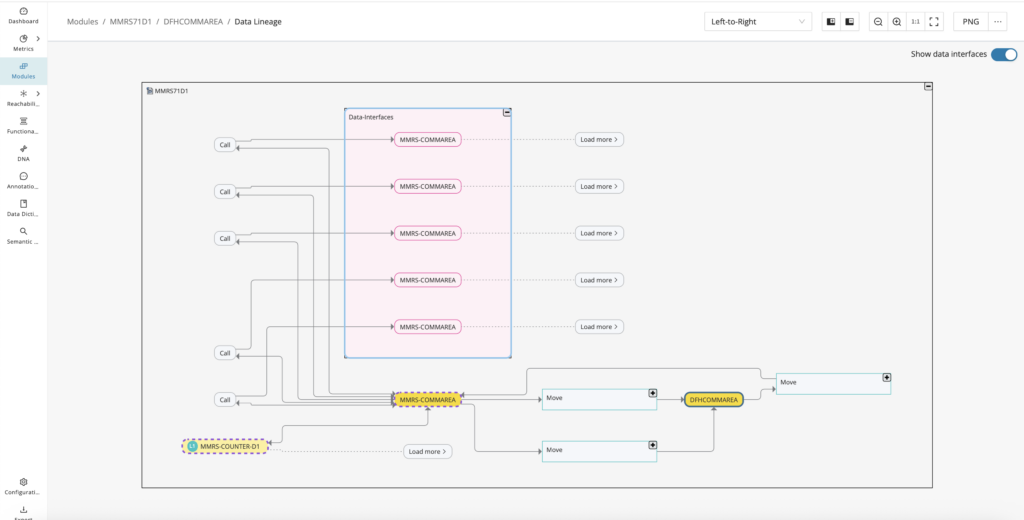
Iterative data flow loading
Iteratively expand the graph to trace data flow for your selected fields across the codebase. By default, the graph will load the immediate intra-module data flow for the initially selected field node. From here, you can click the load more button in various directions to trace the data flow within your starting point module and across modules, going as far across the codebase as needed.
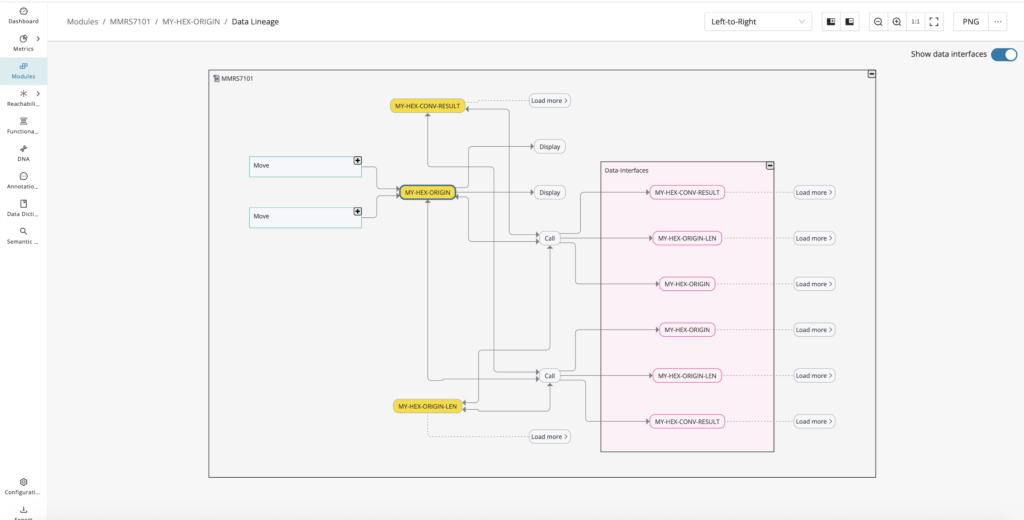
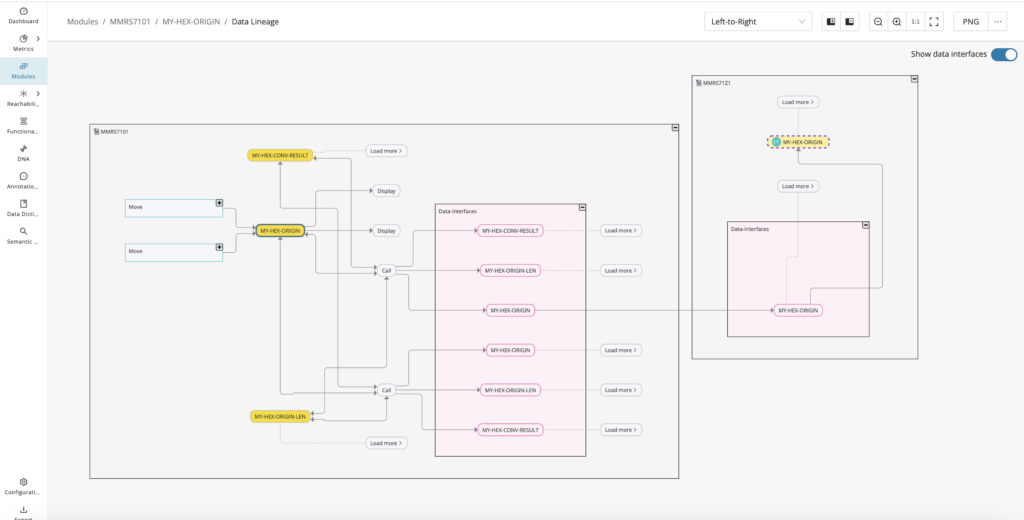
Module overview panel
The side panel of the selected modules displays when any grouped module node is clicked. The side panel has details such as the module name, path, base data (which consists of technology/type), metrics (which consists of total source lines of code/comment lines of code/complexity level), description, custom properties, taxonomies, and annotations.
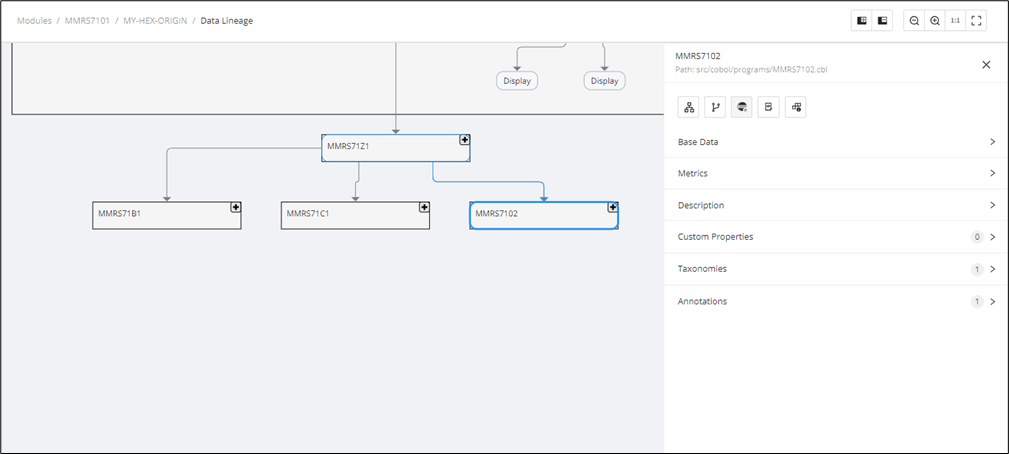
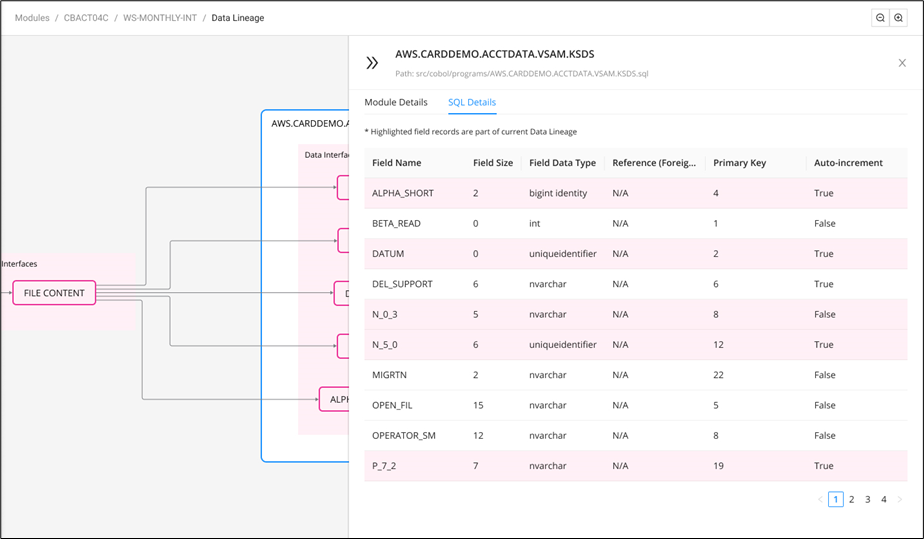
By default, clicking on a module node will show the Module Details tab on the Modules Overview panel. In the case that this Module node is a SQL table node and the associated DB schema has been uploaded, or a SQL script outlining the schema has been discovered, an additional SQL Details tab will be shown.
Source code panel
To display the underlying source code that corresponds to a particular field or statement node within the data flow path on the graph, simply click on the field or statement node. From there, click the side panel icon and the source code panel will appear positioned to the line of code where the field is declared or the statement transformation occurs on the opened side panel.
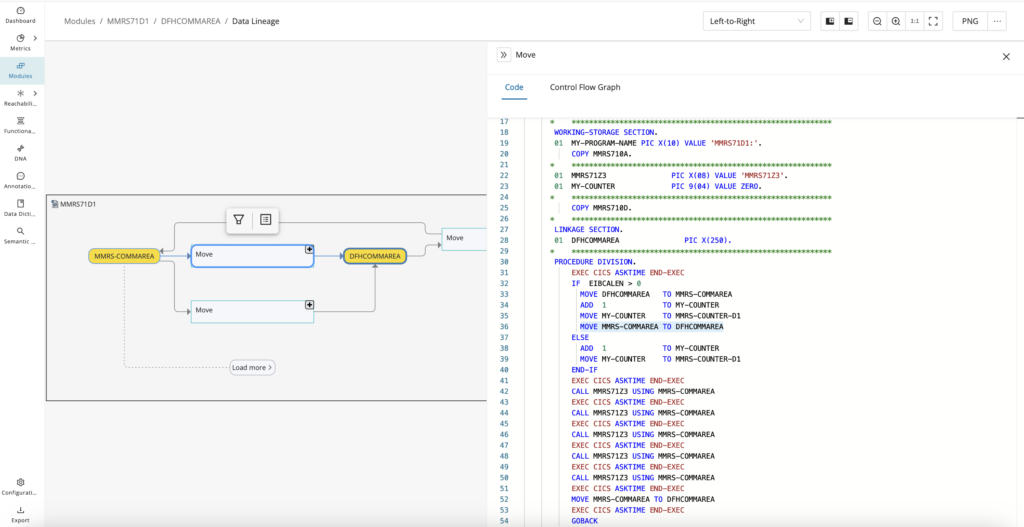
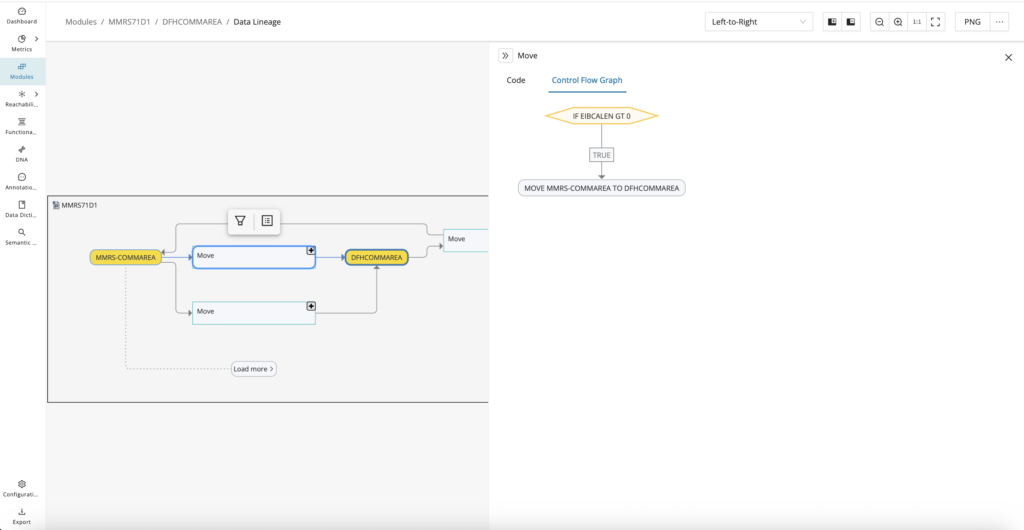
By default, when you click the side panel icon, you see the code tab on the panel that opens. Toward the top of the panel, you can also select the Control Flow Graph tab to see the executable control flow of a statement node, including any conditions or preconditions that must be evaluated before that statement is executed, providing you with greater context without having to manually analyze the source code.
Filtering the graph
As the Data Lineage graph can grow to become quite large after expanding the data flow, there are filtering options available to make it easier to cut through the noise and focus on just the data flow paths or clusters of nodes that are of interest. These filters help isolate the part of the lineage that matters for the question you are investigating. Use them when the full graph becomes too dense to review efficiently.
Show path of neighboring nodes
From the Data Lineage graph, it is possible to get a view of just the nearest neighbor nodes or a node you have selected to see this cluster in an isolated view. Simply click on the field or statement node of interest, and from there, hover over the icon and select "Show path of neighboring nodes".
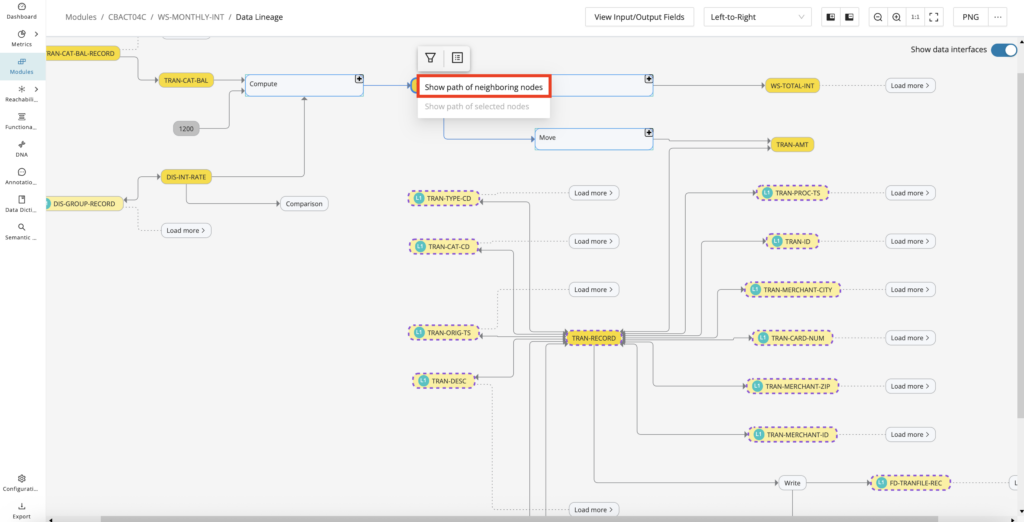
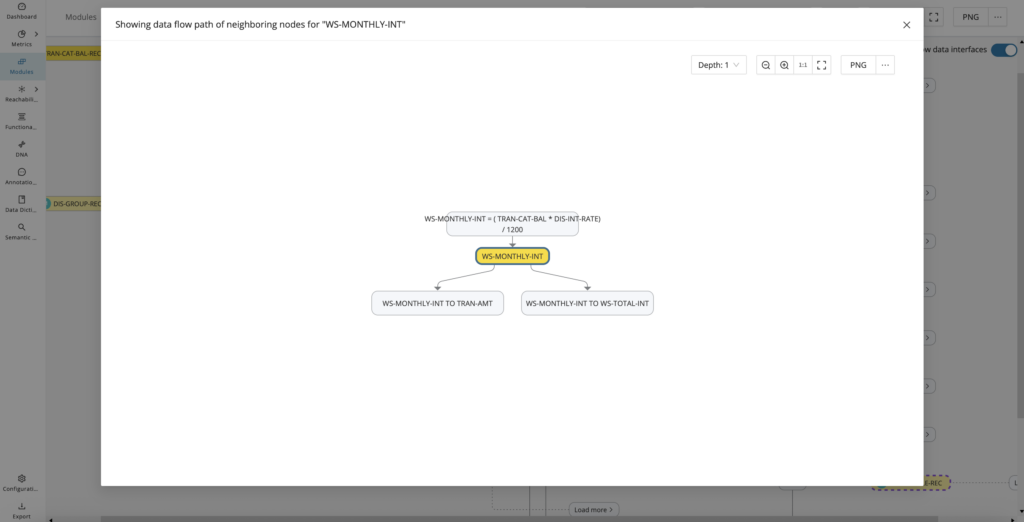
On the pop-up modal, which shows the nearest neighbor nodes of your selected node, the graph view defaults to a depth of 1, but you can configure it on the top right up to a depth of 10. Additionally, you can zoom in and out and export an image of the graph view similar to the main Data Lineage graph.
Show path of selected nodes
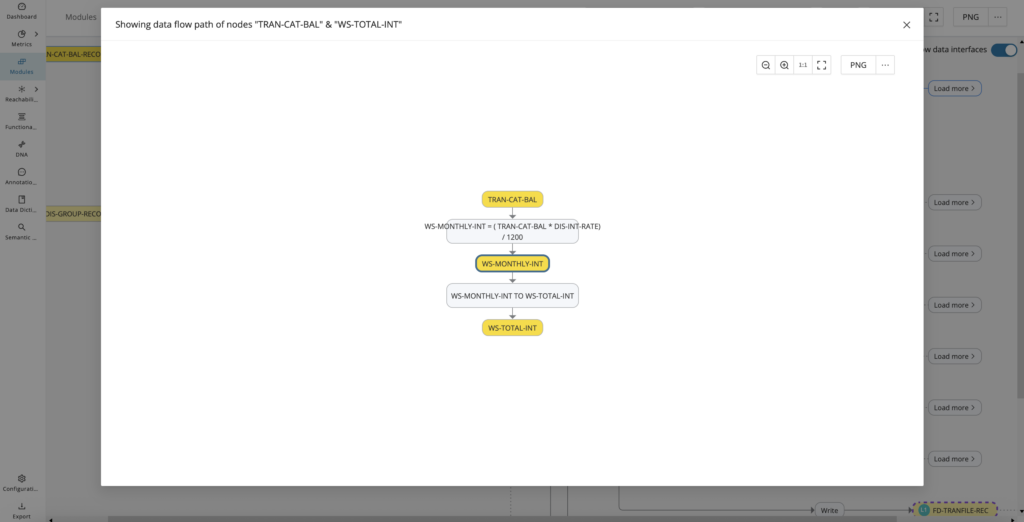
From the Data Lineage graph, when there is a need to analyze the end-to-end data flow path between two nodes, it is possible to filter and extract a view of this single path. Simply click on the "starting point" field or statement node of interest, and while pressing the Control key (Windows)/Command key (Mac), click the "ending point" field or statement node of interest. From there, both selected nodes should be highlighted in blue, and you can hover over the icon and then select "Show path of selected nodes" to see the end-to-end path between your starting and ending selected nodes.
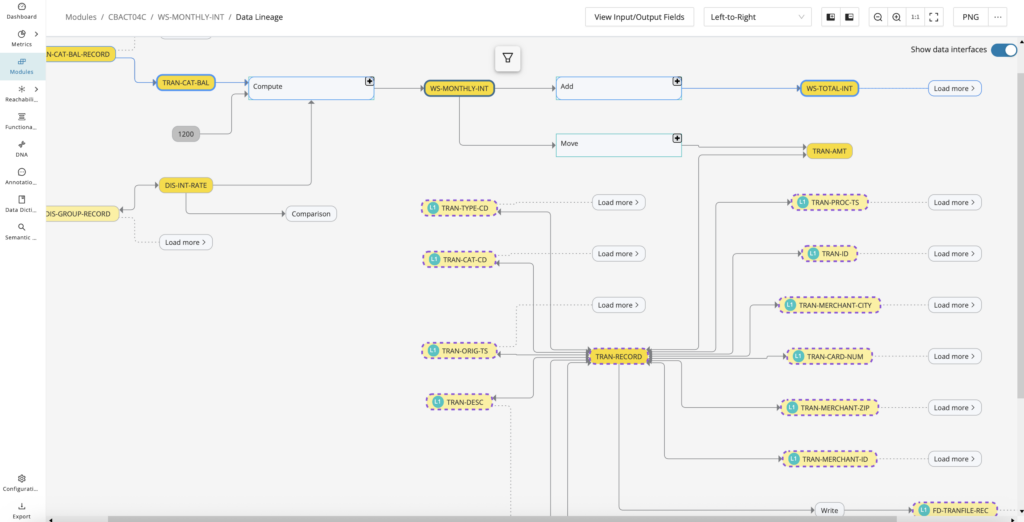
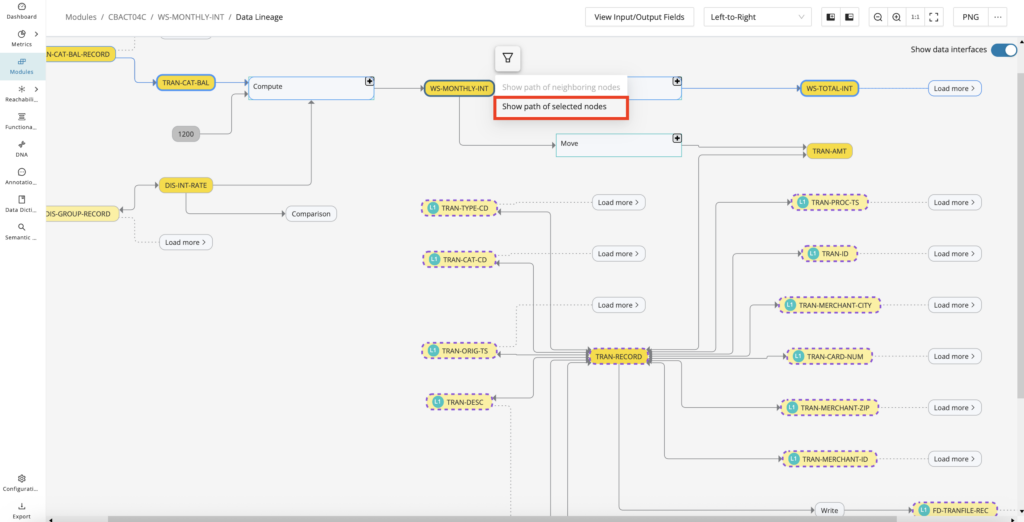
On the pop-up modal, which shows the data flow path between your starting and ending selected nodes, you can zoom in and out and export an image of the graph view similar to the main Data Lineage graph.
Input/output fields
To display the input and output fields associated with read and write statements, click the View Input/Output Fields. When clicked, a new tab displays the data dictionaries related to those fields. To change the layout of the Data Lineage to either the default left-to-right layout or a hierarchical layout, click the dropdown menu shown in the middle of the Data Lineage window.

If no Data Dictionary entries are present from "View Input/Output Fields", an error warning message will be displayed as below.

Exporting graph image
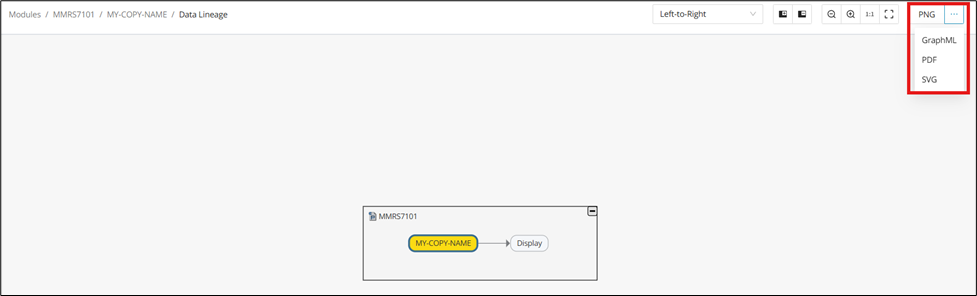
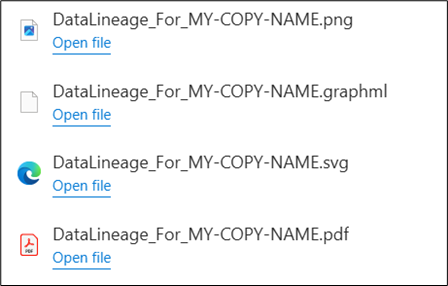
The image export button on the top right has been added to the Data Lineage for export options. PNG(default), GraphML, PDF, and SVG are image formats supported. The Export file name will use the following naming convention: "DataLineage_For_[FieldNameHere]".
Data interface toggling
To show or hide data interfaces, toggle "Show data interfaces" on the top right. This toggle helps you switch between a fuller integration view and a cleaner field-to-field view of the graph. Use it when you need to confirm whether interface nodes are adding necessary context or just visual noise.