Metrics
The visualization of metrics created by Code Discovery is central for the communication of the analyses and revealing unknown aspects of your codebase and data. A variety of charts and drill-downs is provided via the Metrics menu and its sub-pages. Most of these charts are interactive and will provide an overlay listing all related artifacts when they are clicked.
For example, in the Technologies page, clicking a blank area in a bar chart will list all related artifacts within the bar chart, while clicking a specific bar will produce a list of that bar only.
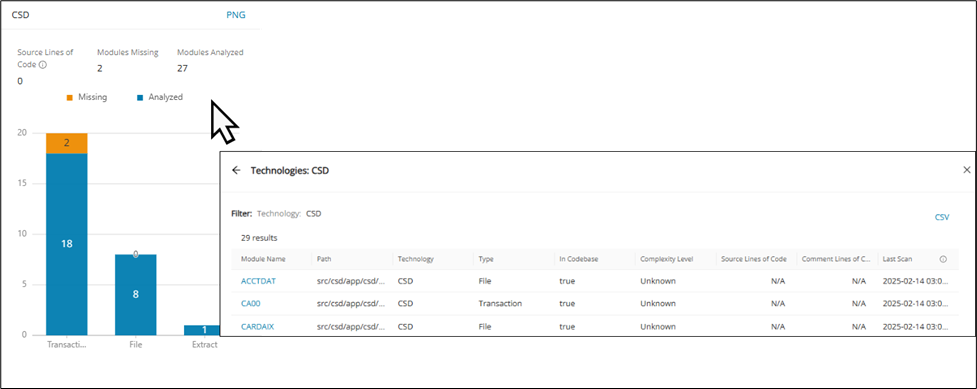
The following sections outline the various metrics available in the Mining Web UI.
Summary
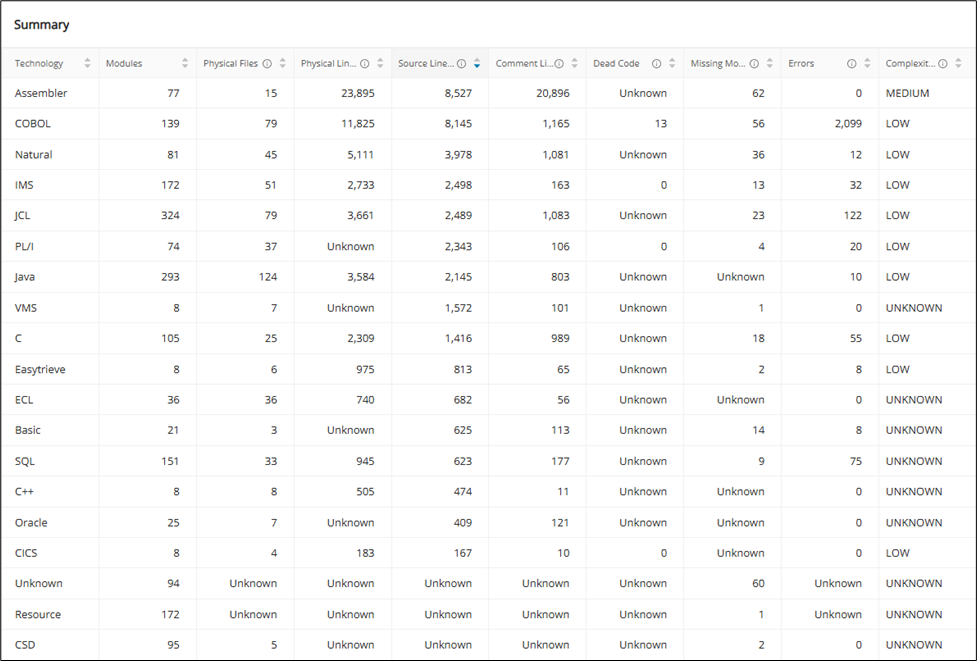
The Summary page gives a quick overview of the number of Modules, files, lines of code, comments, dead code, missing modules, errors, and cyclomatic complexity by technology in tabular form. It is the fastest way to confirm overall project size, quality indicators, and discovery coverage in one place. Use it as a starting point before drilling down into the more specialized metrics pages.
Info
The table in the Summary page cannot be exported to CSV, but can be exported from the Export page by clicking "Download Effort Summary Excel".
Technologies
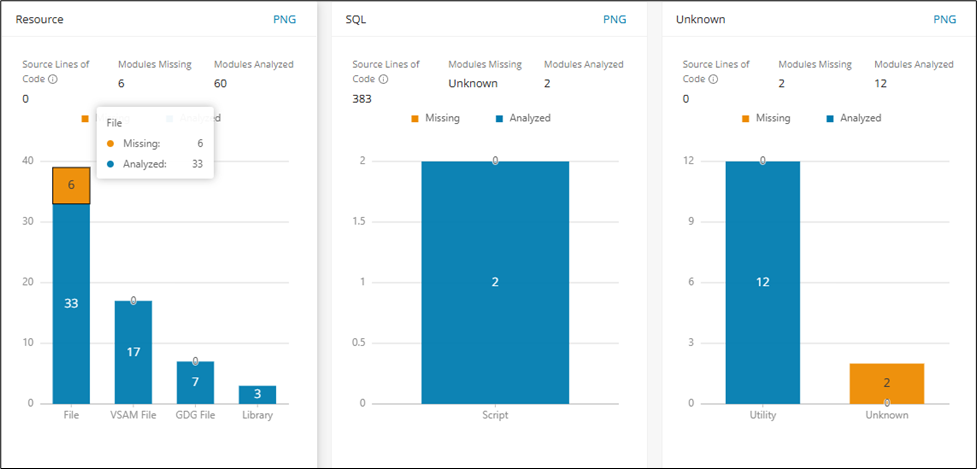
The Technologies page displays a bar chart for each language discovered in the project. Each chart offers information about the lines of code and the number of missing and analyzed artifacts by module type. Hovering over a specific bar gives detailed insight into the missing and analyzed artifacts.
Info
Supported languages are Assembler, BASIC, C, C#, C++, CICS, Cobol, CSD, Easytrieve, ECL, IMS, Java, JCL, Natural, Oracle, PL1, Resource, SQL, and VMS. All others are listed as Unknown.
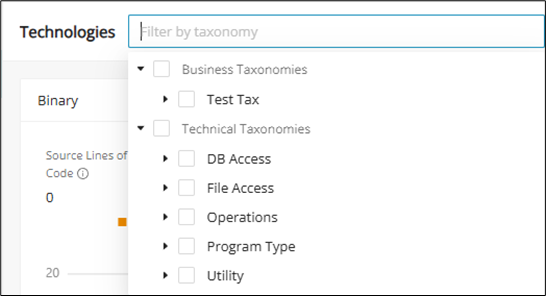
The displayed charts can be filtered by one or more taxonomies from the Filter by Taxonomy field at the top of the page.
Utilities
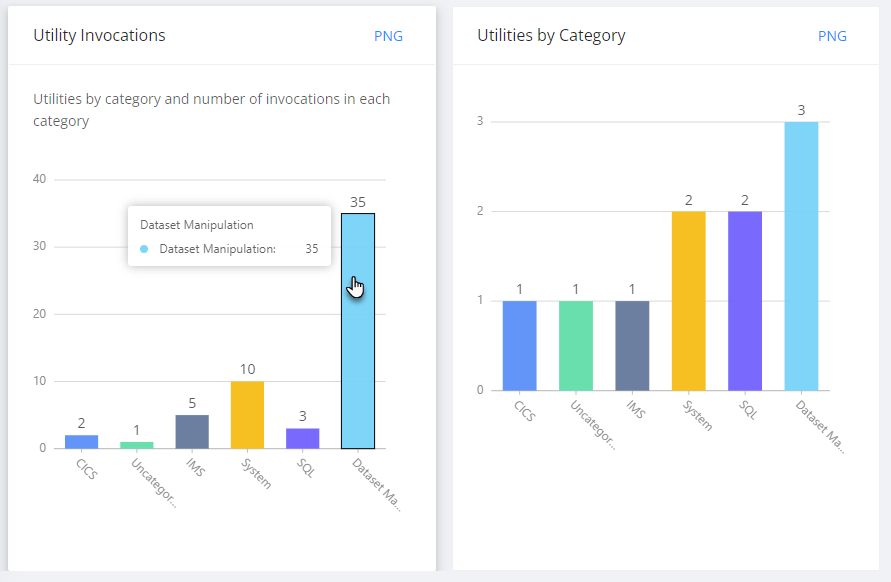
The Utilities page delivers metrics about the project's utilities based on the categories they're invoked in. This view helps you see where shared utilities are concentrated across the portfolio. Use it to spot common helper components and the contexts in which they are invoked.
Interfaces
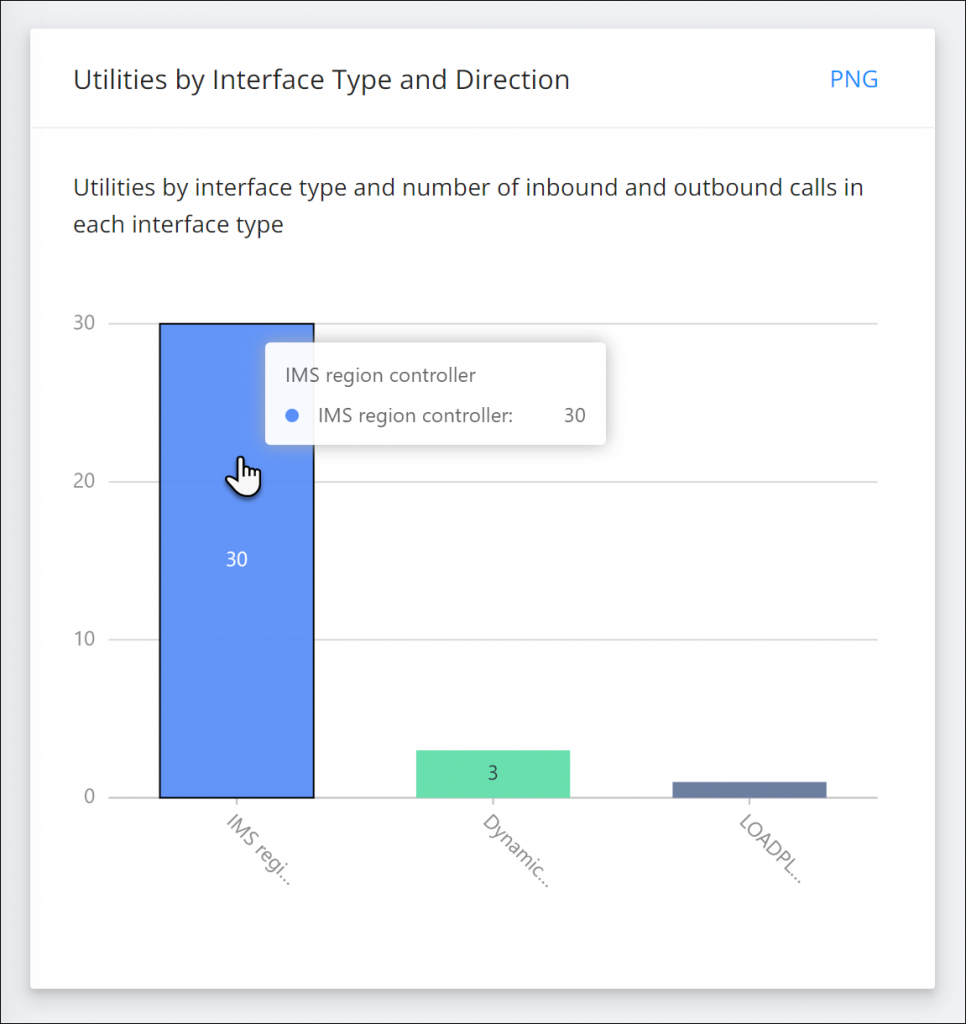
The Interfaces page shows utilities based on the interface type and the number of in- and outbound calls in each interface. This helps you understand how interface-related utilities are distributed across the codebase. Use it to compare inbound and outbound interaction patterns before investigating individual modules.
SQL
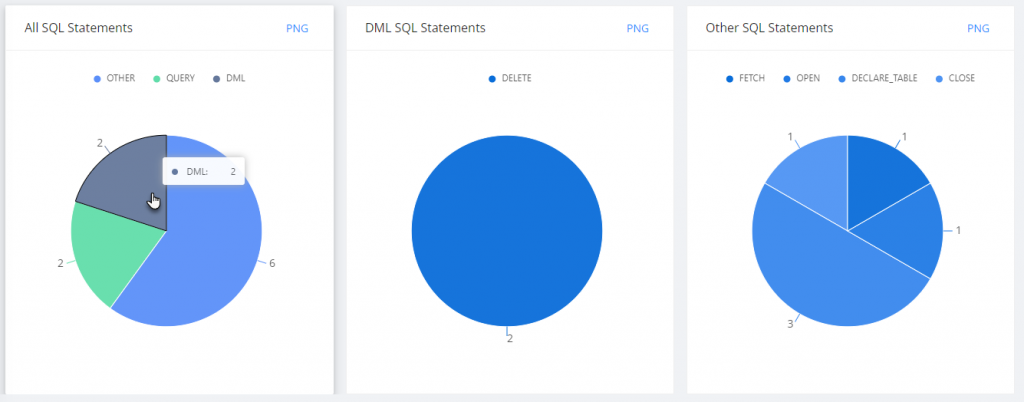
The SQL page offers charts analyzing the project's SQL statements. This view helps you assess how extensively SQL is used across the project. Use it to inspect statement-heavy areas and then open the related overlays for module-level detail.
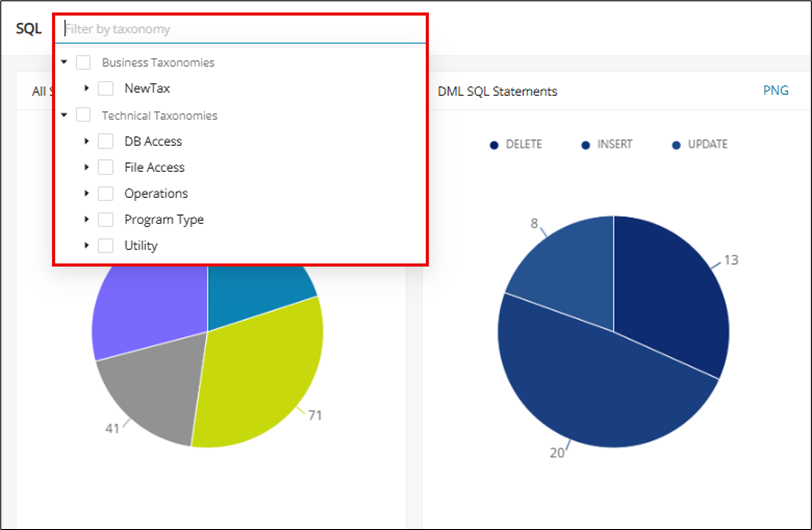
The displayed charts can be filtered by one or more taxonomies via the Filter by Taxonomy field at the top of the page.
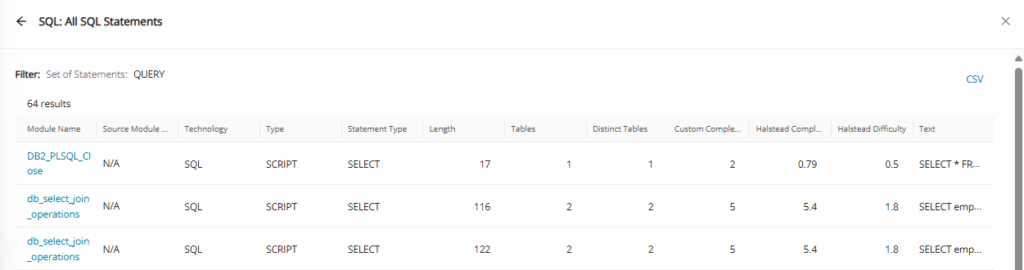
Clicking any of these charts will display a pop-up window with a table related to the chart. This table contains detailed information like the Module Name, Complexity, Technology, Type, etc. It is possible to click the module name to navigate directly to the module details page.
IMS
The IMS page offers charts analyzing the project's IMS calls and functions.
The displayed charts can be filtered by one or more taxonomies via the Filter by Taxonomy field at the top of the page.
In this view, it is possible to click the module name to navigate directly to the module details page.
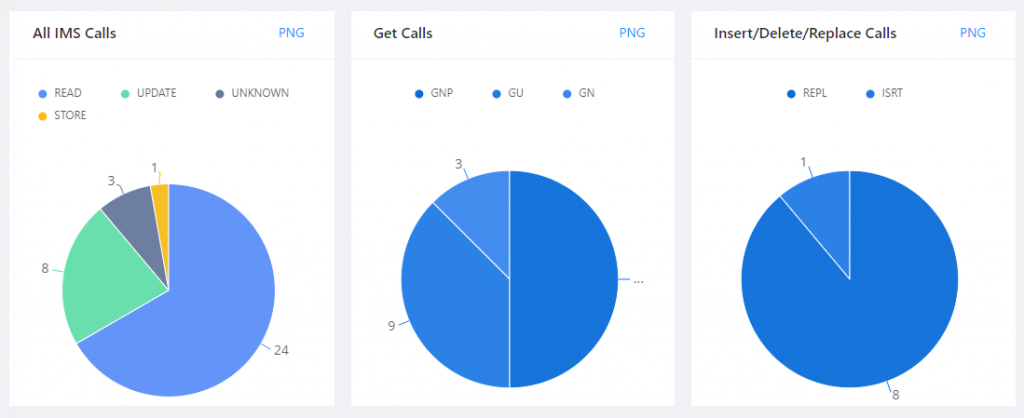
The following calls are supported:
| Function | Category | Description |
|---|---|---|
| GU | Get | Get Unique - like read |
| GN | Get | Get Next - like read next |
| GHU | Get | Get Hold Unique - specifies that a lock (hold) on the record happens after the unique record retrieval |
| GHNP | Get | Get Hold Next within Parent - get next within parent call, and locks (holds) the record |
| GHN | Get | Get Hold Next - reads the next record on the hierarchical data path and locks (holds) it |
| ISRT | Insert | Insert - adds new segments |
| DLT | Delete | Delete - removes segments |
| REPL | Replace | Replace - replaces segments used along with GHNP, GHU, or GHN |
| PCB | PCB | CICS programs |
| CHKP | Others | Checkpoint function - recovery process |
| XRST | Others | Restart function |
IDMS
IDMS is a network-style mainframe database platform used by many long-running enterprise systems. In a typical estate, business logic lives in COBOL and PL/I programs that issue IDMS DML (Data Manipulation Language) statements and navigate schema structures such as records, sets, areas, and subschemas. Modernizing IDMS is rarely a matter of syntax conversion alone. The harder problem is understanding the hidden behavior of the code: which programs read versus update which records, how set relationships drive data navigation, and where control flow and data dependencies create migration risk.
The IDMS page brings this intelligence together in a dedicated metrics area aligned with modernization planning. Code Discovery parses IDMS usage across COBOL and PL/I to build the inventory, dependency, and distribution views described below. Use the sub-menu on the left of the page to move between the Summary, DML operations, DML statements, Program record dependency, Language distribution, and IDMS schema structure views.
Key IDMS terms
These terms appear throughout the IDMS views:
- Schema: the full IDMS database definition, covering all record types, sets, and areas.
- Subschema: a program-specific view of a schema that exposes only the records, sets, and areas a program needs.
- Record: a business data object, such as customer or order data.
- Set: an owner-member relationship that links records and drives navigation between them.
- Area: the storage zone where related records are physically organized.
- DML (Data Manipulation Language): the statements programs use to read and change the database, such as
OBTAIN,FIND,STORE,MODIFY,ERASE,CONNECT, andDISCONNECT. - Currency: the pointers that track a program's current position in the database during DML execution, spanning run-unit, record, set, and area currency.
- DB, DC, and LRF: DB statements access stored database records, DC (data communication) statements handle online and terminal interaction, and LRF (Logical Record Facility) statements access data through logical records that can span several physical records and sets.
Summary
The Summary page is the landing view for IDMS and gives a high-level snapshot of the IDMS footprint. The header cards report the Total programs, Total lines of code, and DML statements discovered. The Program language breakdown chart shows the split between COBOL and PL/I, while the IDMS entities and Architecture components panels count the schema building blocks (total entities, sets, areas, maps, schemas, and subschemas) alongside the lines of code contributed by each language. The Top schema by size chart ranks schemas by the number of components they contain.
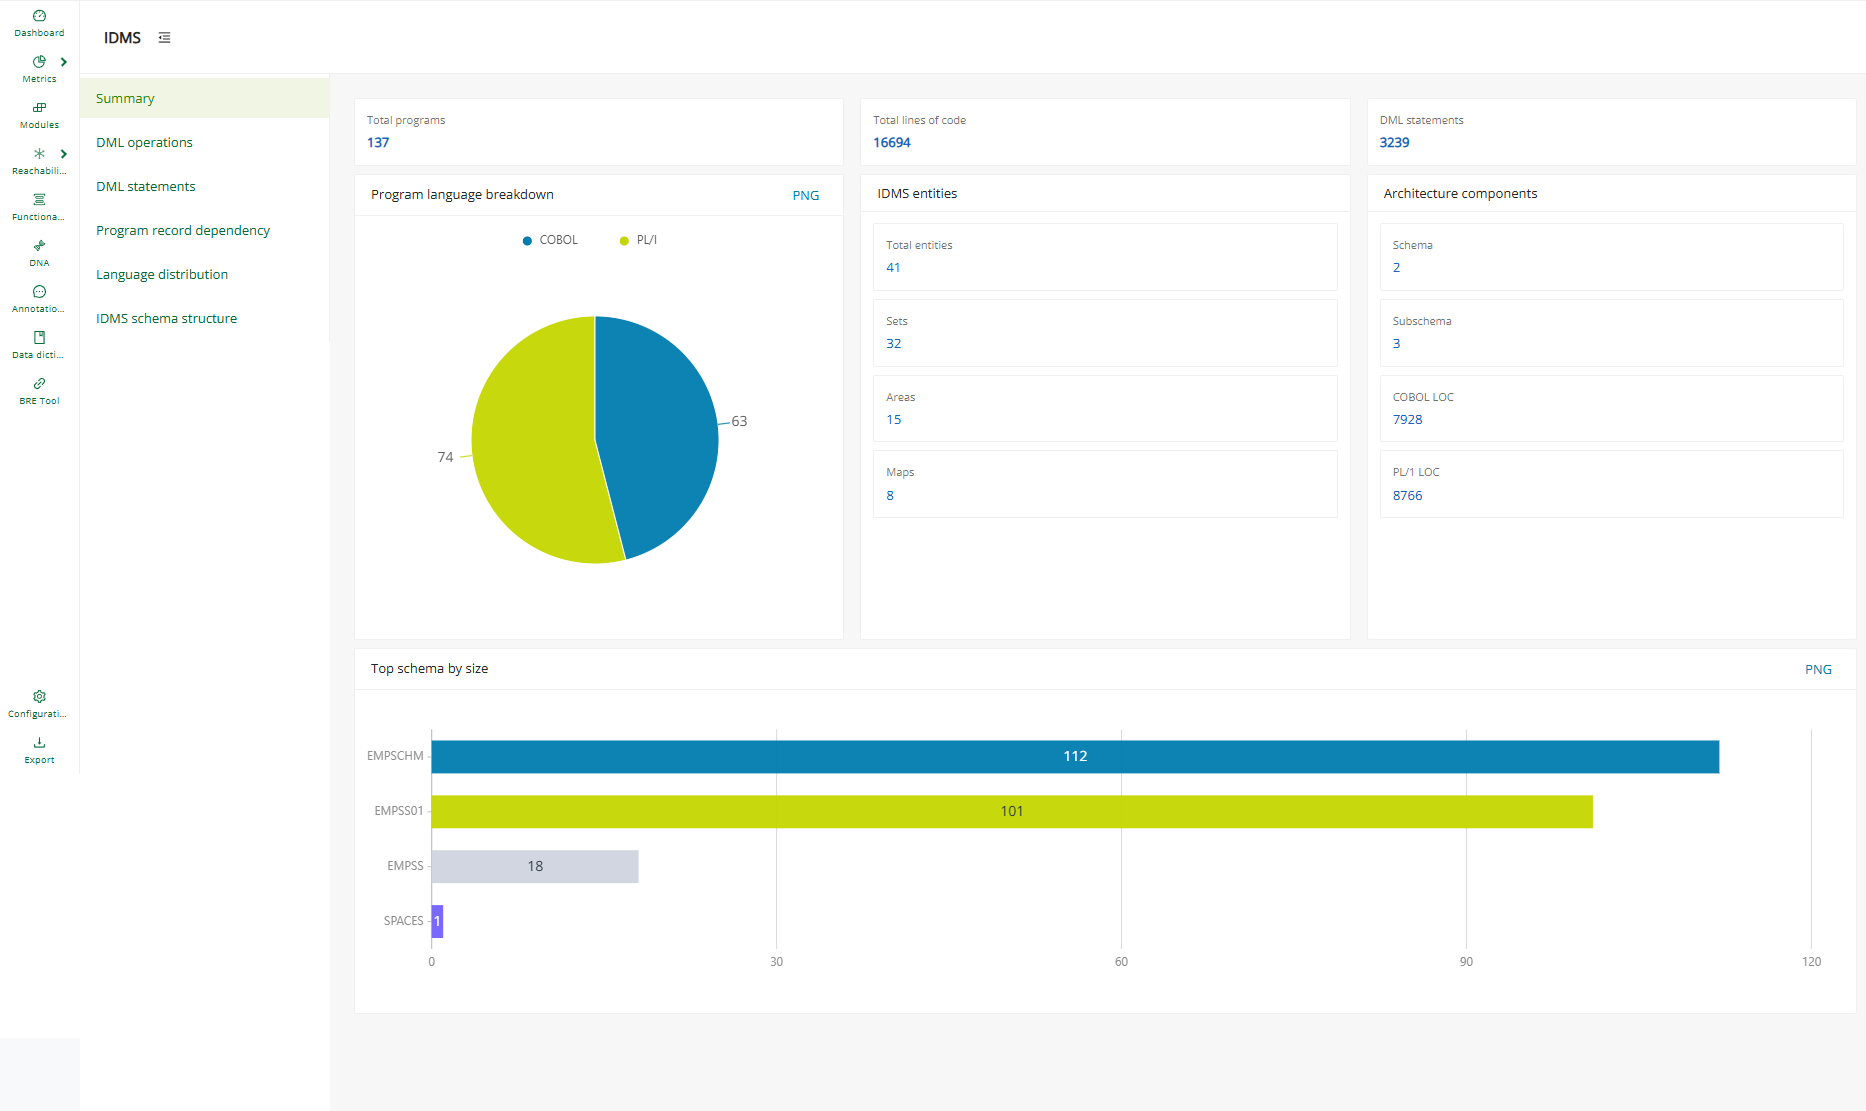
Use this page to confirm the overall size and composition of the IDMS estate before drilling into the more specialized views.
DML operations
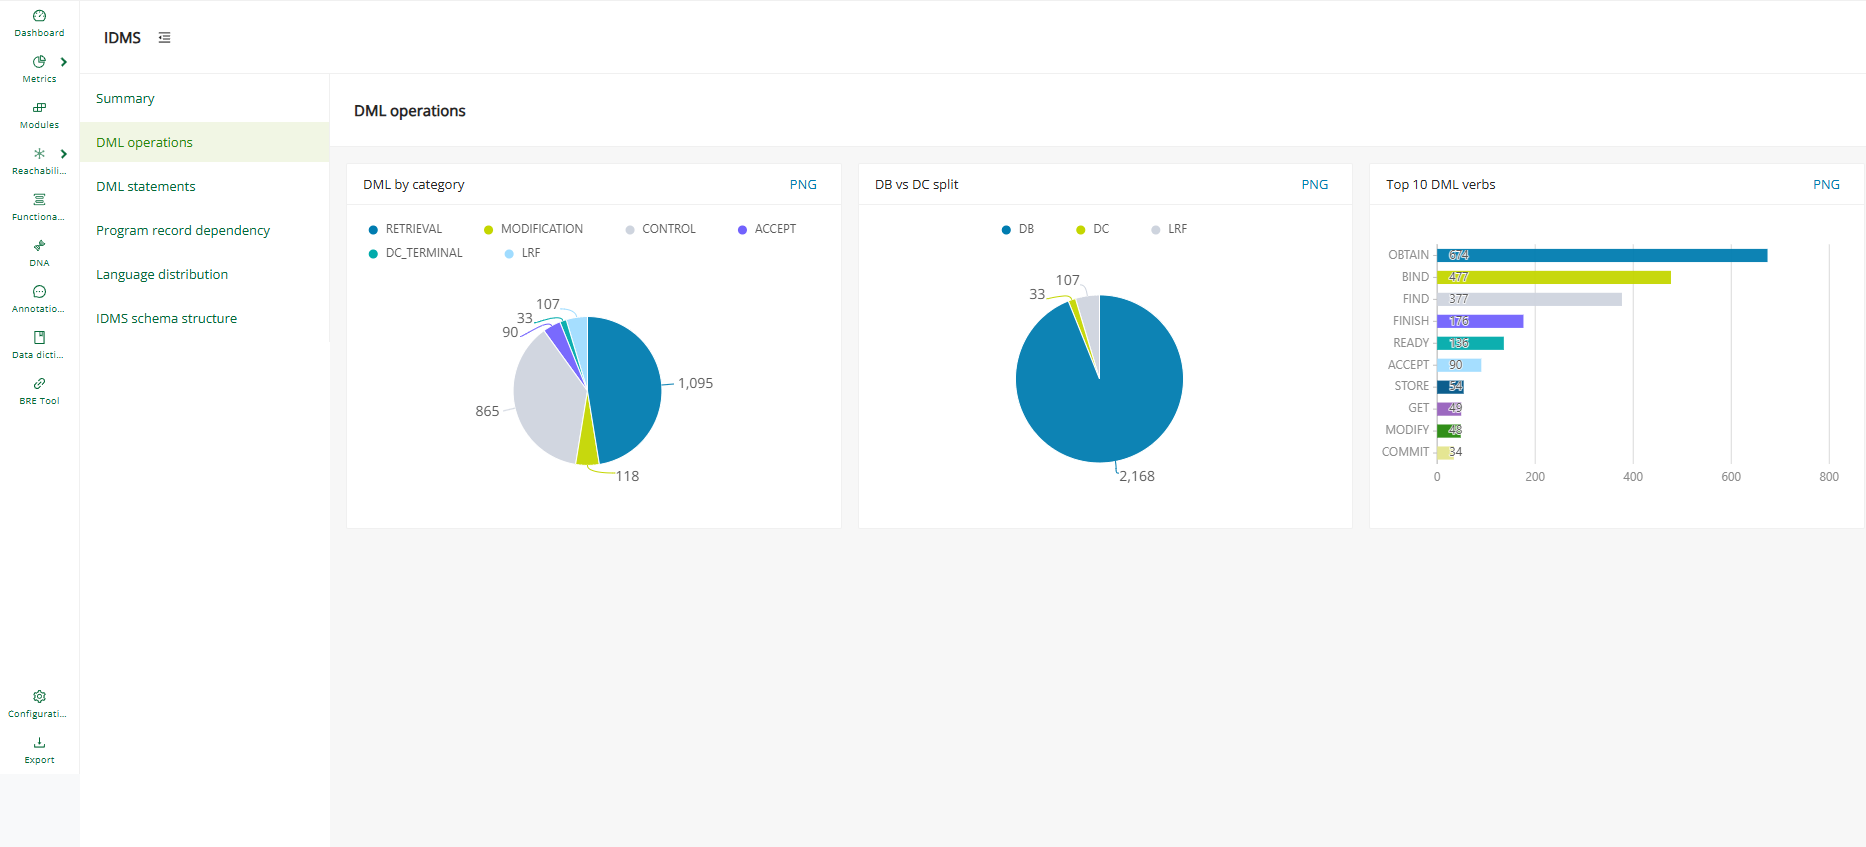
The DML operations page describes how the code interacts with the database at the operation level. The DML by category chart groups statements into retrieval, modification, control, accept, DC terminal, and LRF categories to reveal the dominant access patterns. The DB vs DC split chart separates database (DB) access from data communication (DC) activity, and the Top 10 DML verbs chart ranks the most frequently used verbs, such as OBTAIN, BIND, FIND, and FINISH.
DML statements
The DML statements page quantifies IDMS statements in more detail. The DML category distribution card summarizes the total statements split across DB, DC, and LRF, and separate cards break the totals down into Retrieval calls, Modification calls, Recovery statements, Accept statements, and the DC Category. Each card lists the verbs that make up its category, so it is easy to see which retrieval, modification, or recovery verbs dominate the codebase.
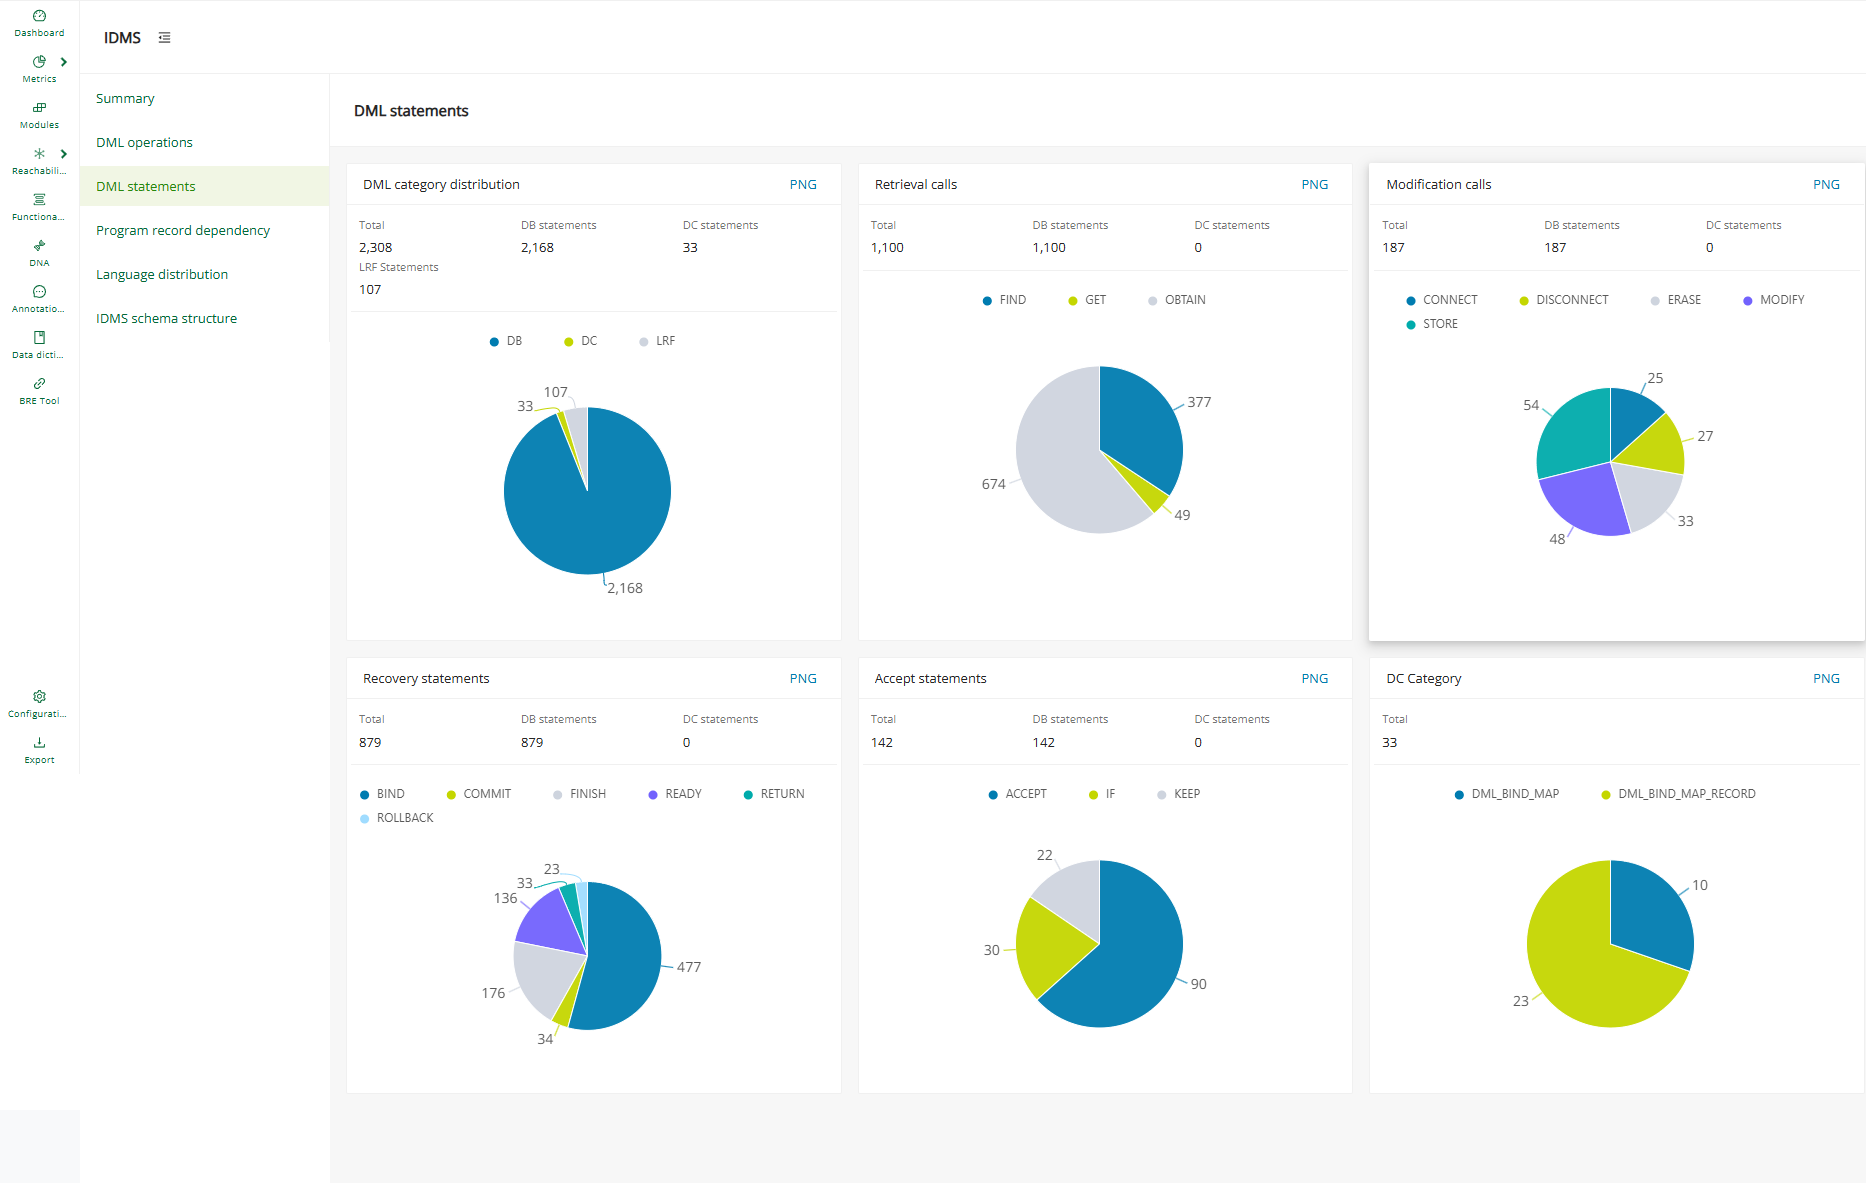
Program record dependency
The Program record dependency page lists the programs that interact with IDMS records and sets, supporting impact and change analysis.
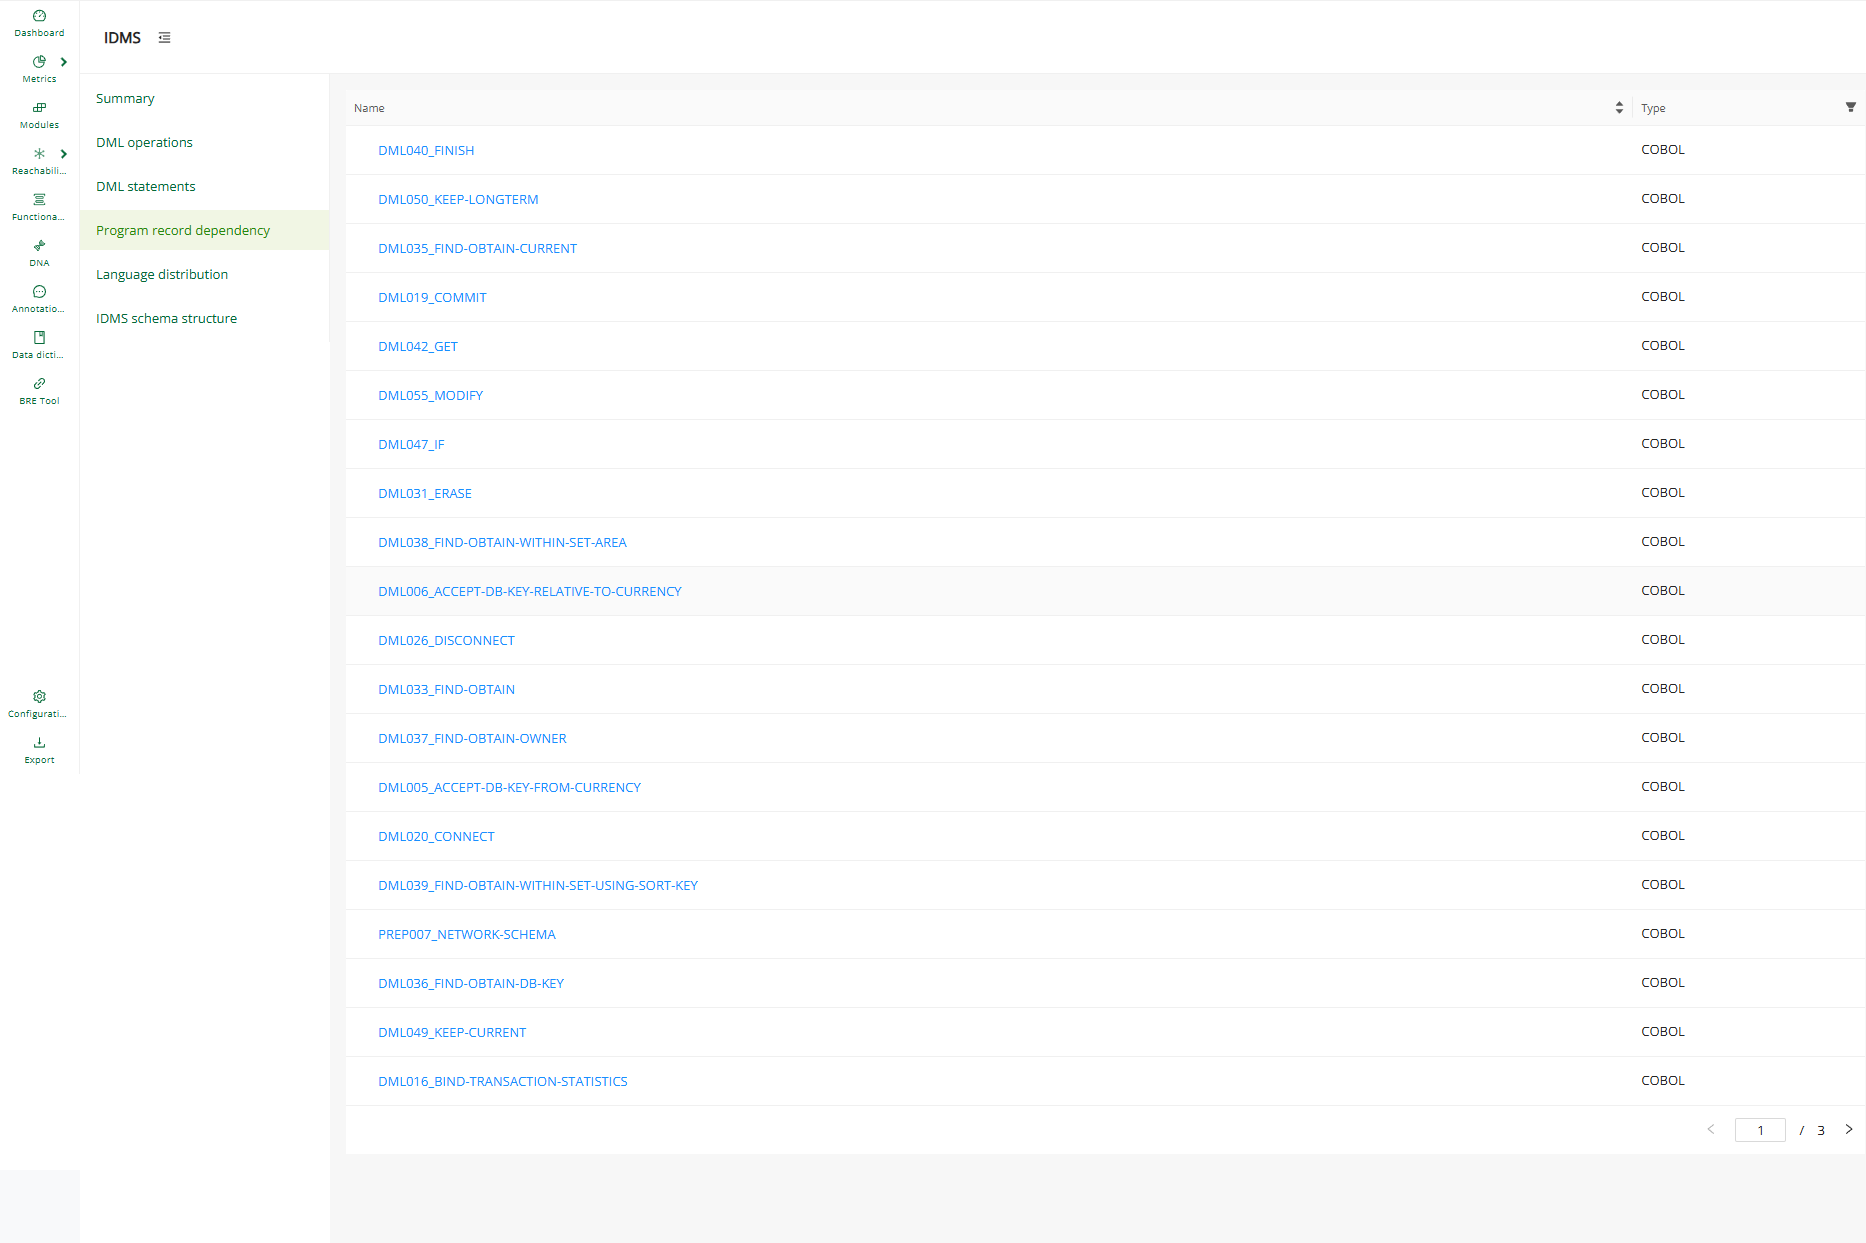
Select a program name to open its dependency diagram that shows the Record and IDMS set nodes the program touches and the OWNER and MEMBER relationships that connect them. Use the zoom, fullscreen, and Show orphan nodes controls to explore the diagram, and the About this graph button for the legend and guidance.
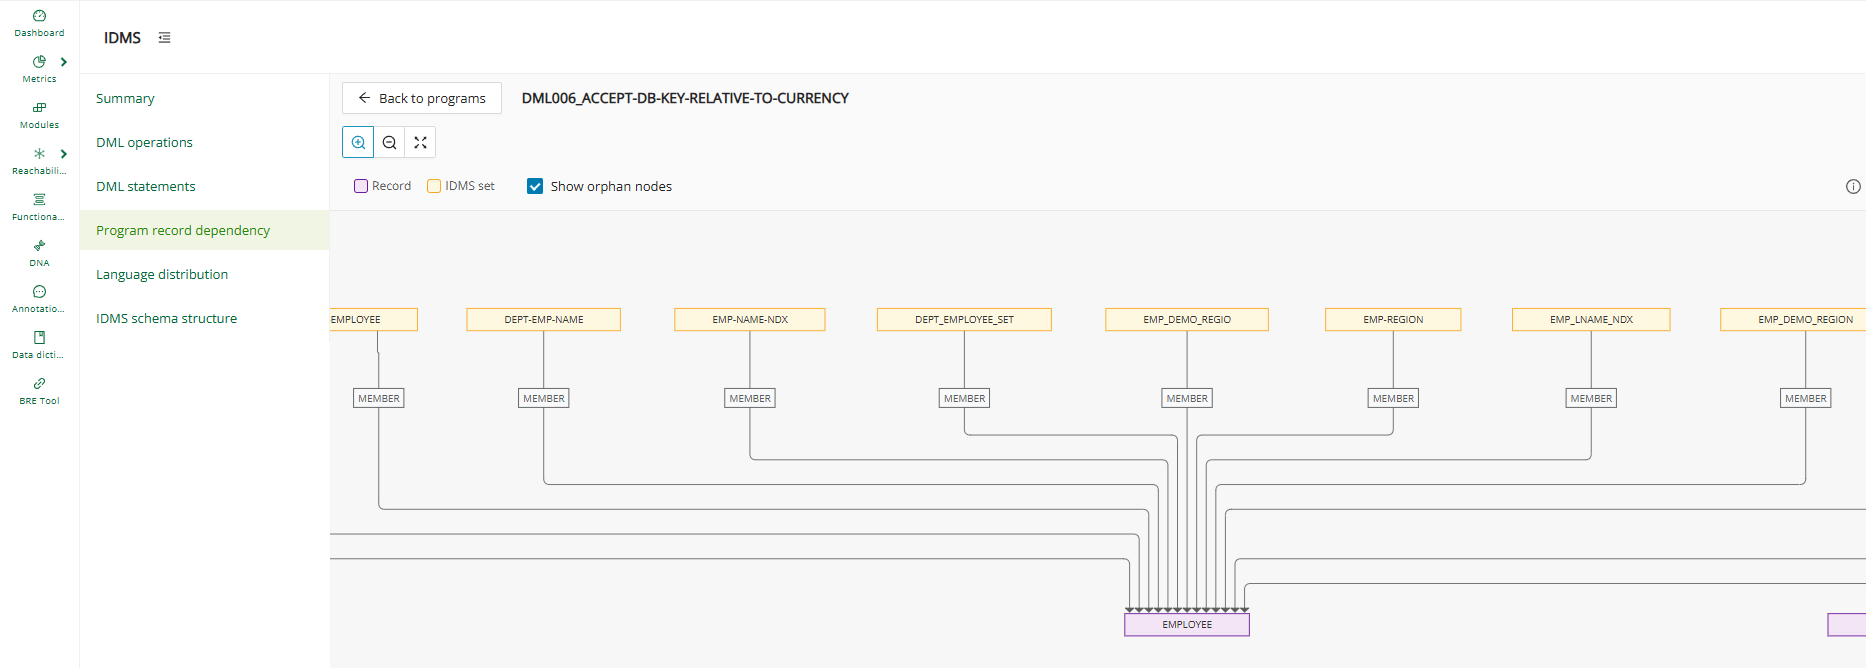
This view answers core change-impact questions early: if a record or set changes, which programs are affected, and which areas of the estate are tightly coupled.
Language distribution
The Language distribution page shows where IDMS logic resides by language (COBOL versus PL/I) to help sequence migration work. Narrow the chart to a subset of the codebase with the Filter by taxonomy field at the top of the page.
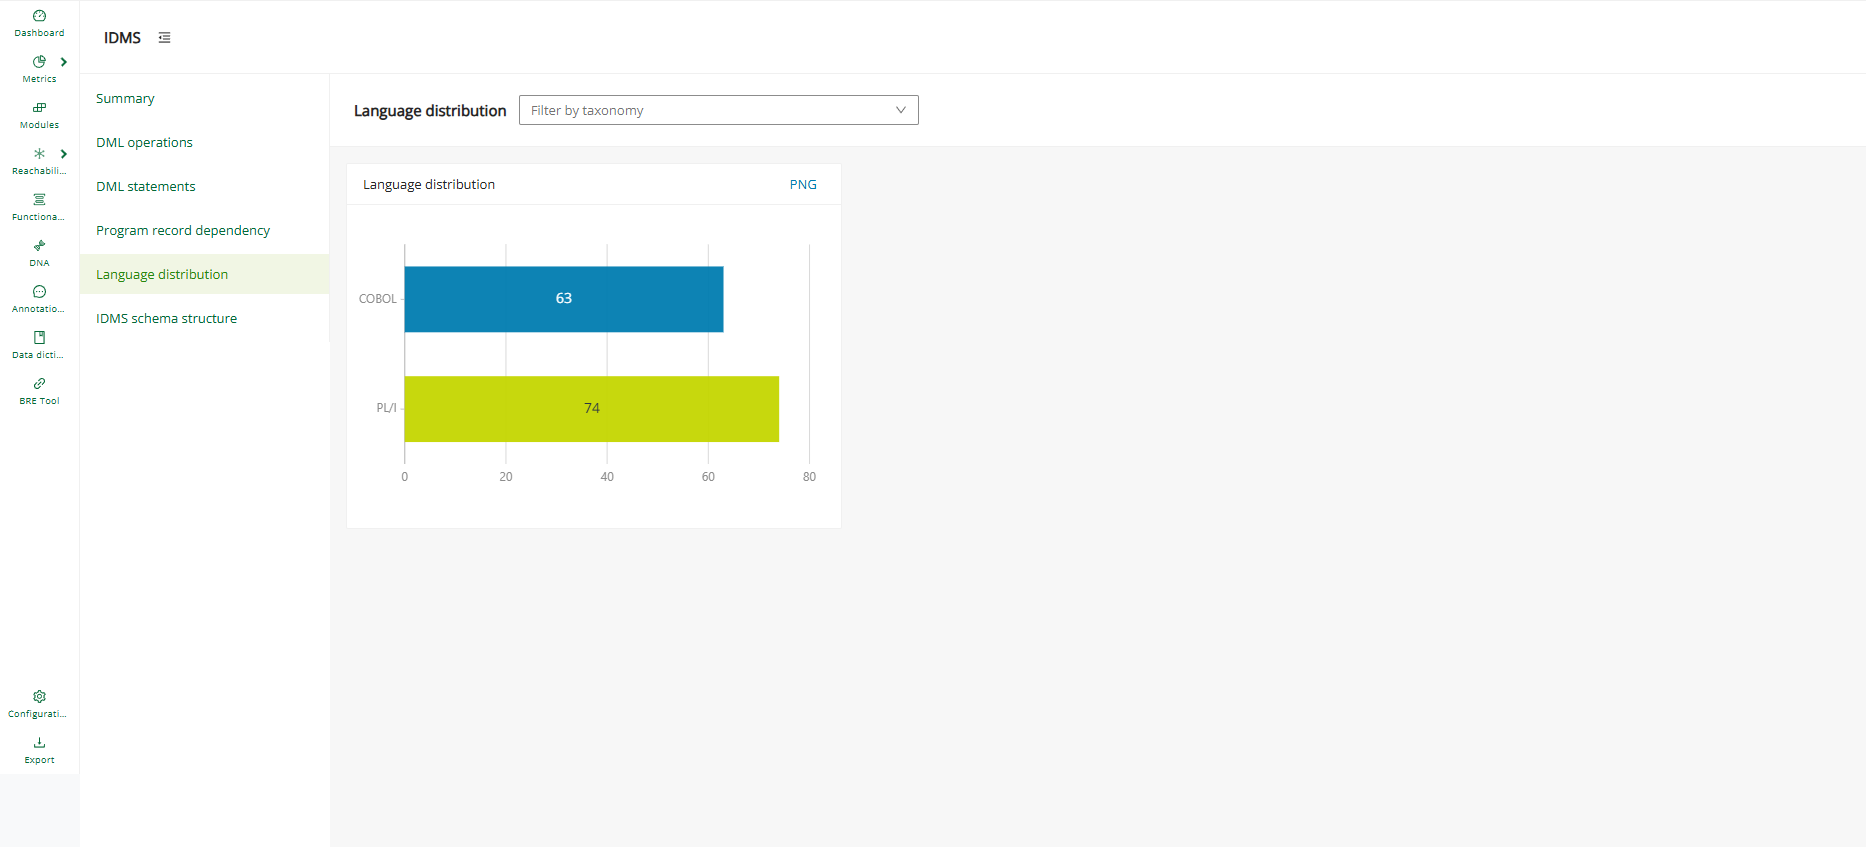
IDMS schema structure
The IDMS schema structure page presents schema-level components and their relationships to support architecture understanding of the IDMS database design.
Decomposition
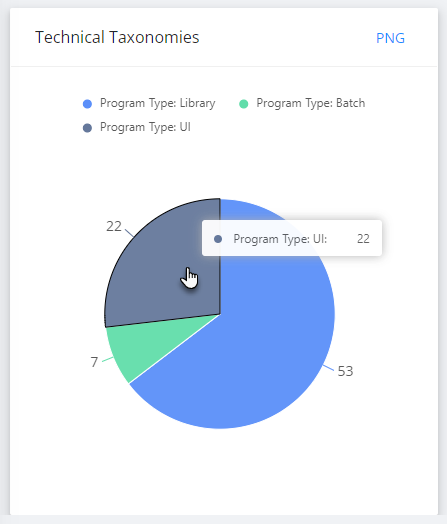
The Decomposition page shows metrics for Technical Taxonomies according to the category they were assigned to in the project, for example, (batch vs online).
The displayed charts can be filtered by one or more taxonomies via the Filter by Taxonomy field at the top of the page.
The overlay contains a table with additional information like the module name, the path to the module, the technology, and the lines of code. It is possible to click the module name to directly get to the module details page.
Info
As a prerequisite, the Identify Technical Taxonomies feature needs to be executed from the Modules Reporting page to gather the corresponding data.
Code quality
The Code Quality page hosts various charts about the project's complexity, code lines, job steps, and SQL statements.
The displayed charts can be filtered by one or more taxonomies via the Filter by Taxonomy field at the top of the page.
The overlay contains detailed information such as the kind of statement, the complexity, and the lines of code. Click on the zoom icon to have a closer look at any Code Quality chart.
Complexity analysis
| Metrics | Definition |
|---|---|
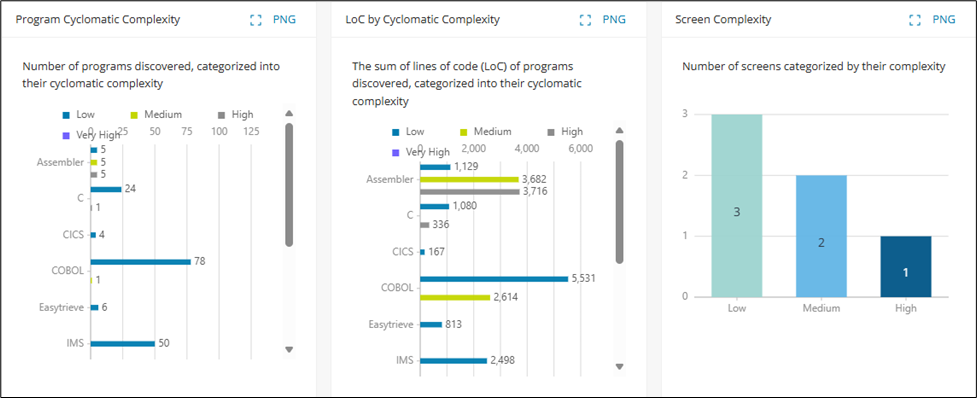
| Cyclomatic Complexity | The complexity Level calculation uses the standard McCabe formula to apply a common definition of cyclomatic complexity for supported programs. It quantifies the number of independent linear paths of a program based on its control flow. The formula used to calculate the complexity score is as follows: C = N + 1 (where N is the number of decisions/conditions). |
Info
For Cyclomatic Complexity, the low-to-high program scoring categorization is applied based on the underlying complexity score: Low: 1-10, Medium: 11-20, High: 21-50, Very High: >51
Code lines analysis
| Metrics | Definition |
|---|---|
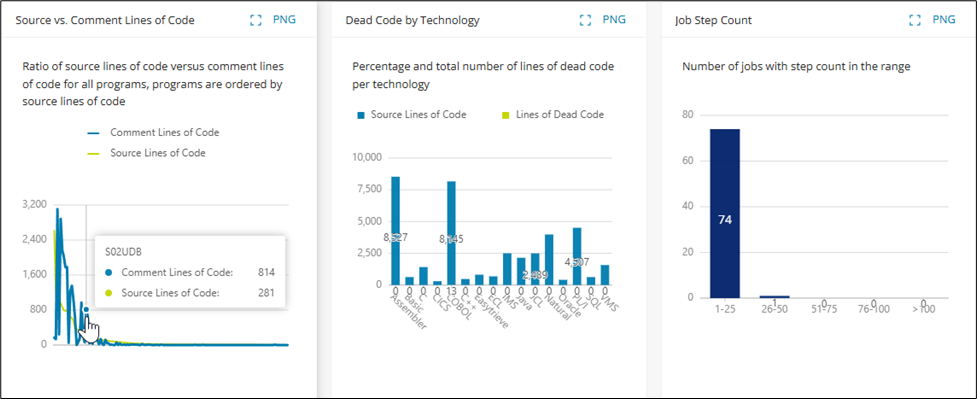
| Source Lines of Code | The code line count of a module is the sum of non-blank lines in the unassembled source containing code instructions of that language. Comment lines do not count toward the source lines of code. |
| Comment Lines of Code | The comment line count of a module is the sum of non-blank lines in the unassembled source containing only a comment instruction of that language. Lines that contain code and comments do not count toward the lines of comments. |
| Dead Code | Dead code describes lines of code found to be unreferenced or unused, and therefore never executed at runtime. |
SQL analysis
| Metrics | Definition |
|---|---|
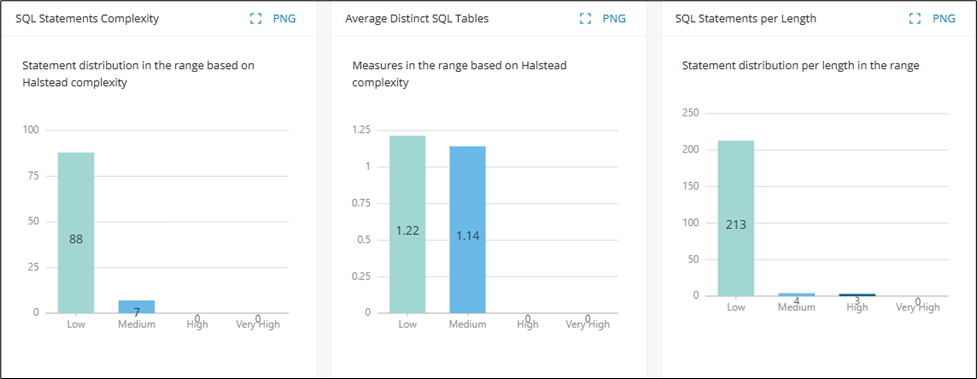
| Statement Complexity | Represents the complexity of an SQL statement based on the overall amount of parsed SQL nodes, for example, (Operators, Identifiers, Literals) that comprise the statement. |
| Halstead Complexity | The Halstead complexity calculation measures the complexity of a program by looking at the number of operators and operands and their overall usage. Halstead complexity scoring categories are applied based on the underlying complexity score and statement length: - Low: 1-10 (1-400 characters) - Medium: 11-20 (401-800 characters) - High: 21-50 (801-1200 characters) - Very High: >50 (>1200 characters) |
| Distinct Tables | Distinct tables are all tables accessed by modules, not accounting for duplicates/repeated access of the same table. |
Candidates
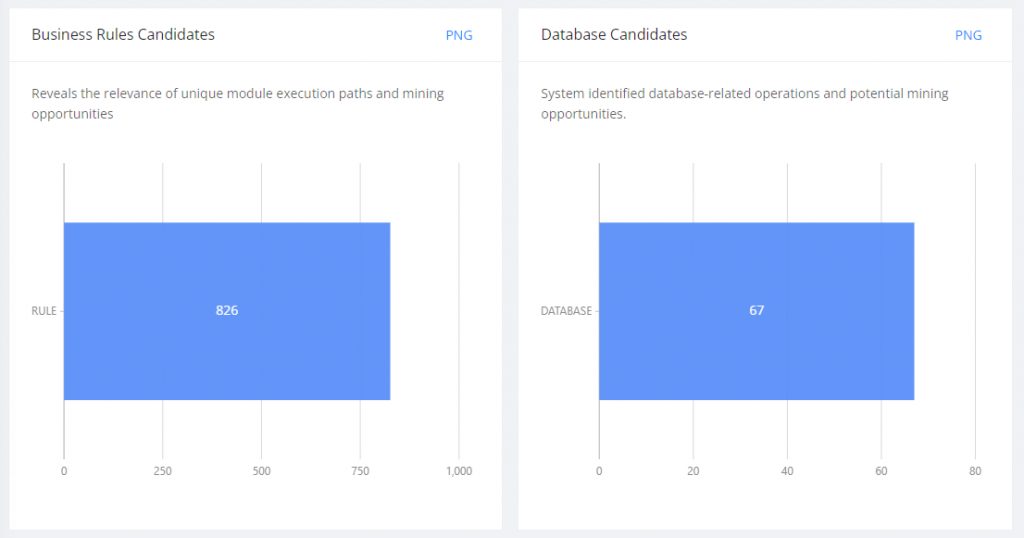
The Candidates page visualizes the data gathered as a result of executing Identify Candidates.
The displayed charts can be filtered by one or more taxonomies via the Filter by Taxonomy field at the top of the page.
Info
As a prerequisite, the Identify Candidates feature needs to be executed to gather the corresponding data.