Reports
Use Reports to review bounded-context interconnections, modules that are not part of a bounded context, and the visual context graph. These pages provide exportable views of the current decomposition state so you can validate decisions outside the graph editors. Use them when you need a report-oriented summary of context structure and gaps.
Connected Context
The Connected Context report focuses on the relationships between bounded contexts and the modules that create those links. It is useful for understanding where context boundaries still depend on each other and for reviewing those interconnections in a table-based format. To use it, export the Bounded Contexts and modules file from Mining and import it into Unified Cutter, or move taxonomies to contexts from Taxonomy Editor.
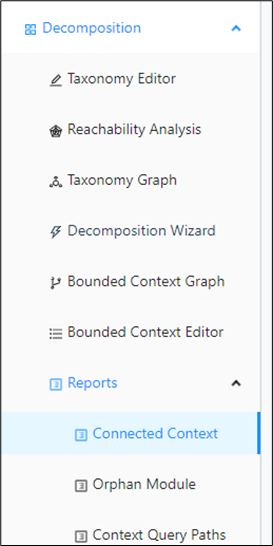
In the left navigation panel, navigate to Decomposition > Reports > Connected Context.
The connected context report is displayed as a table:
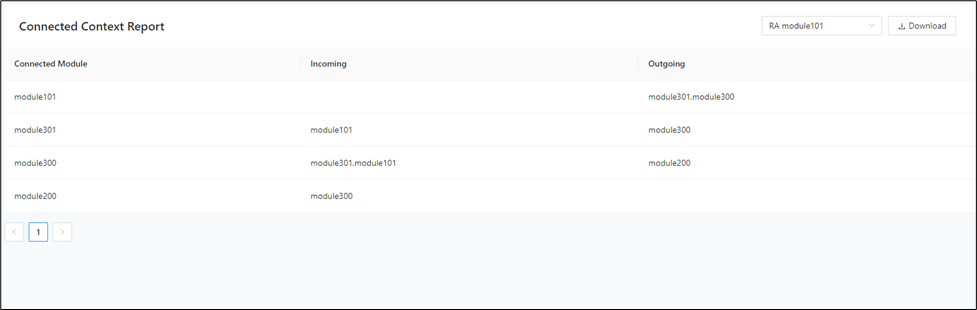
It shows the connected modules in the selected bounded context together with the incoming and outgoing module information.
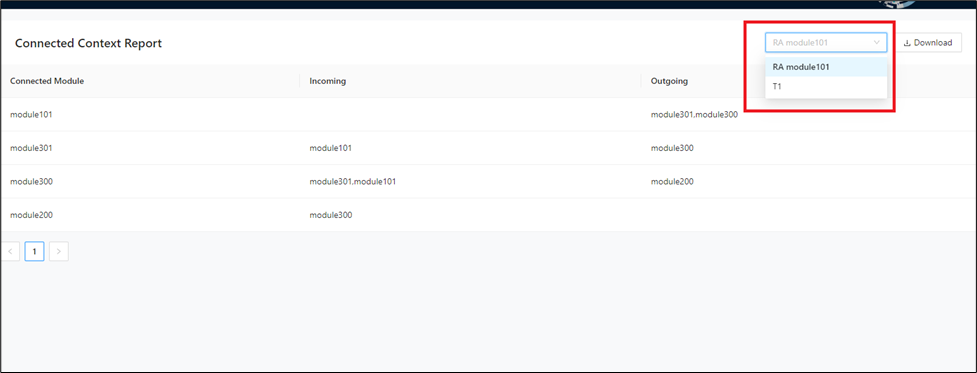
Use the dropdown to switch between different contexts.
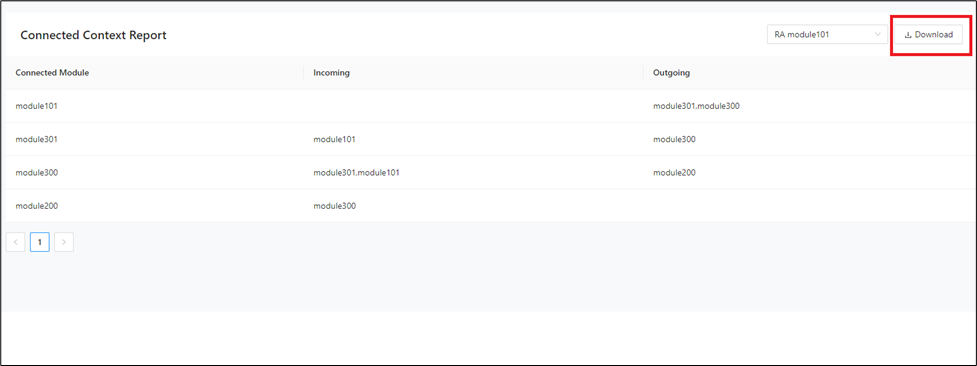
Click Download to download the report in a file.
Orphan Module
The Orphan Module report shows modules that are currently outside the selected bounded context and may still need classification. It helps you identify decomposition gaps and leftover modules that are not yet represented in the target structure, making it useful when you want to find work that remains before a context model is complete. To use this report, export the Bounded Contexts and modules file from Mining and import it into Unified Cutter, or move taxonomies to contexts from Taxonomy Editor.
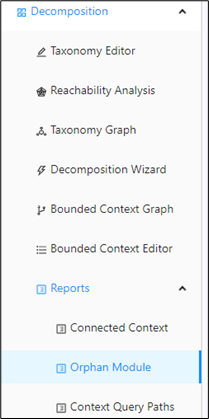
In the left navigation panel, navigate to Decomposition > Reports > Orphan Module.
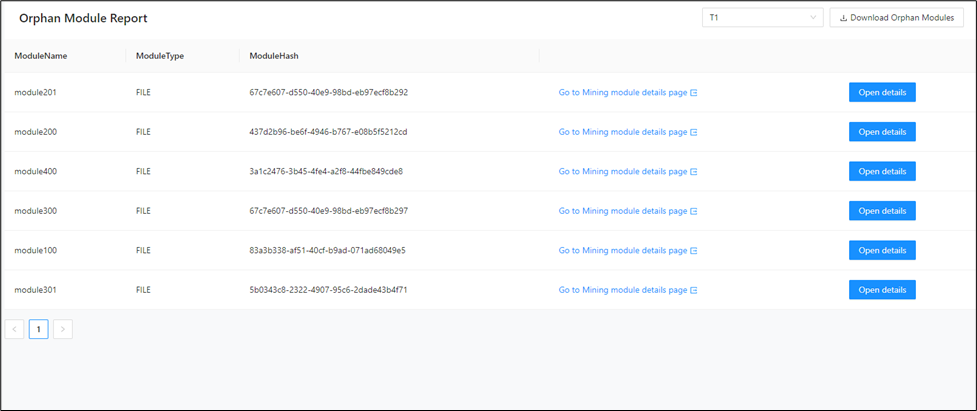
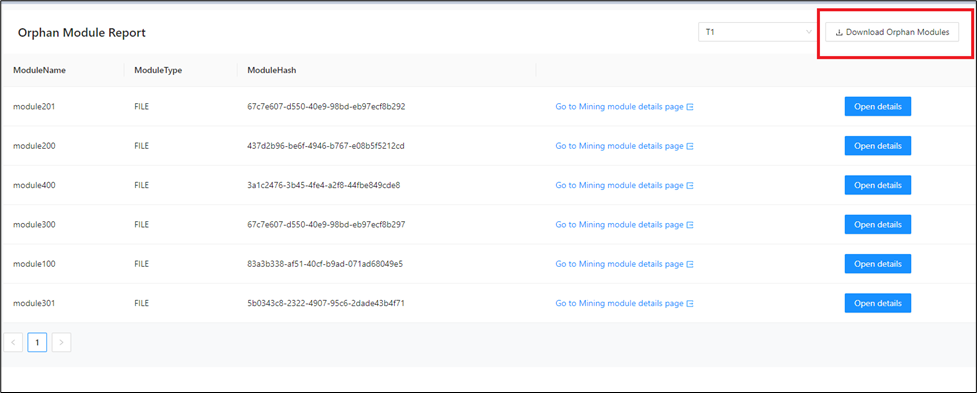
The report is displayed as a table with the module name, type, module hash, link to the Mining UI, and details of the incoming and outgoing dependencies.
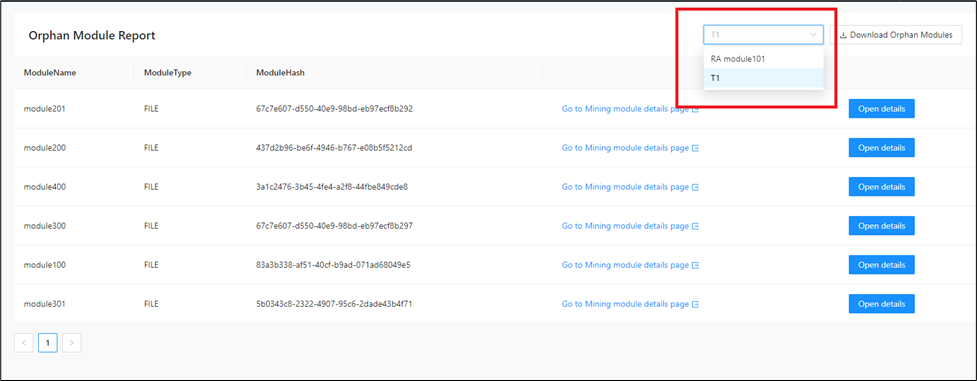
Use the dropdown to switch between different contexts.
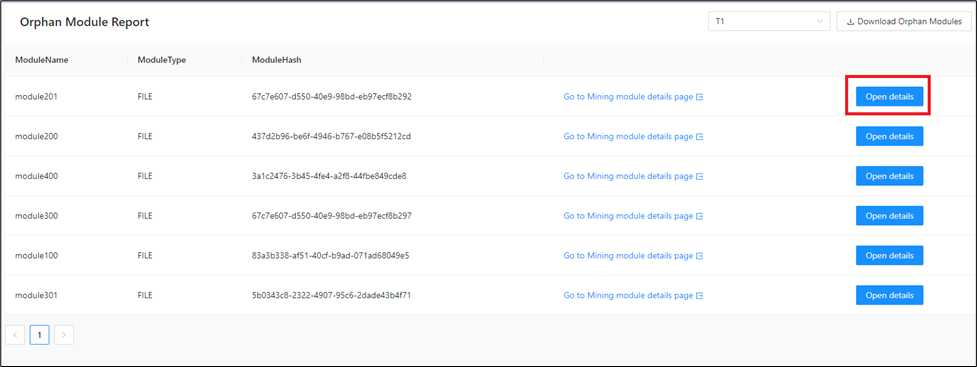
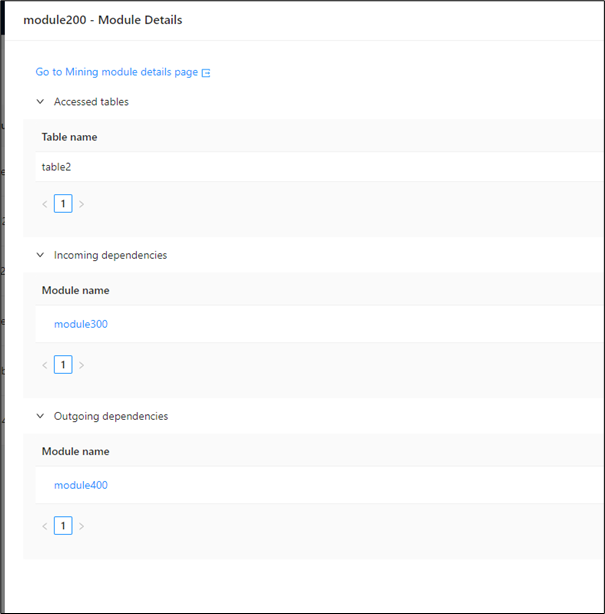
Open Details shows the accessed table, the incoming and outgoing dependencies of the module, and a link to the Mining UI.
Click Download to download the report in a file.
Context Query Paths
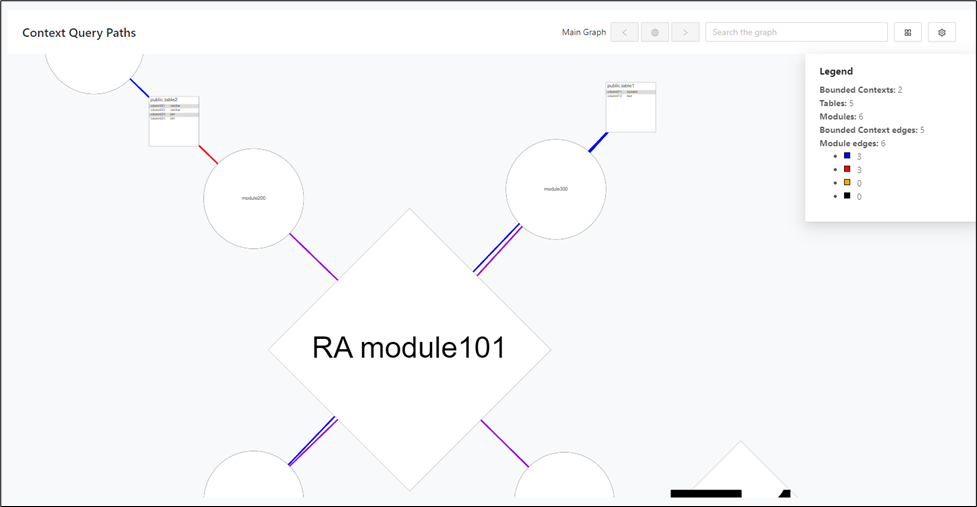
The Context Query Paths page combines bounded contexts, modules, and tables into a graph so you can inspect ownership and access behavior together. It is especially helpful when you want to review context structure alongside the database objects each context touches and to make targeted context updates from the graph. To use this page, export the Bounded Contexts and modules file from Mining and import it into Unified Cutter, or move taxonomies to contexts from Taxonomy Editor.
In the left navigation panel, navigate to Decomposition > Reports > Context Query Paths.
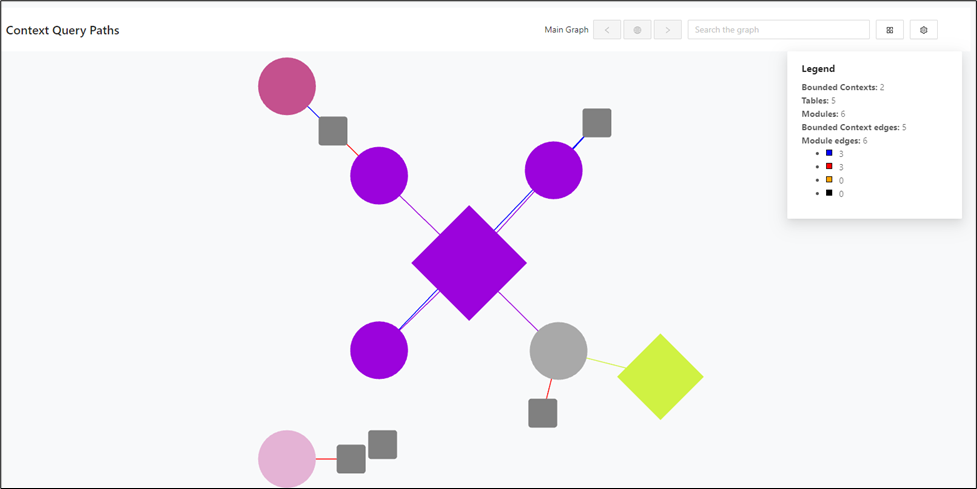
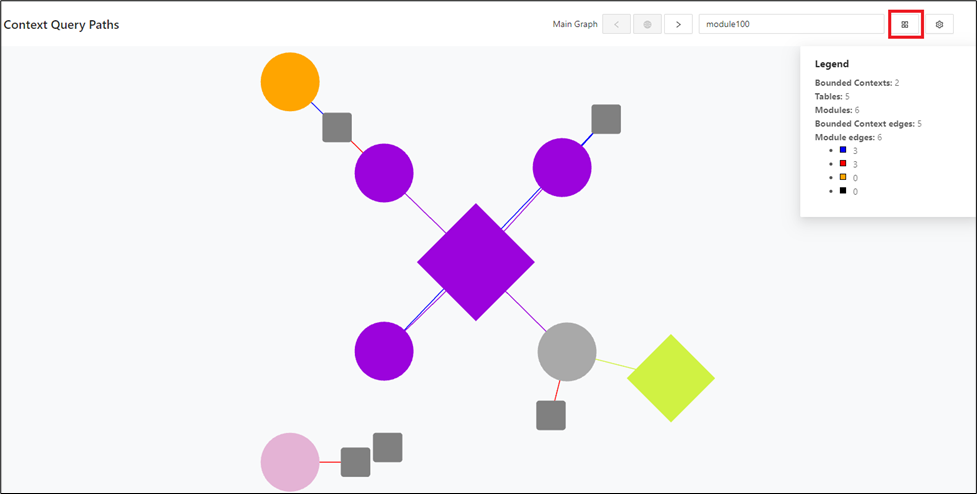
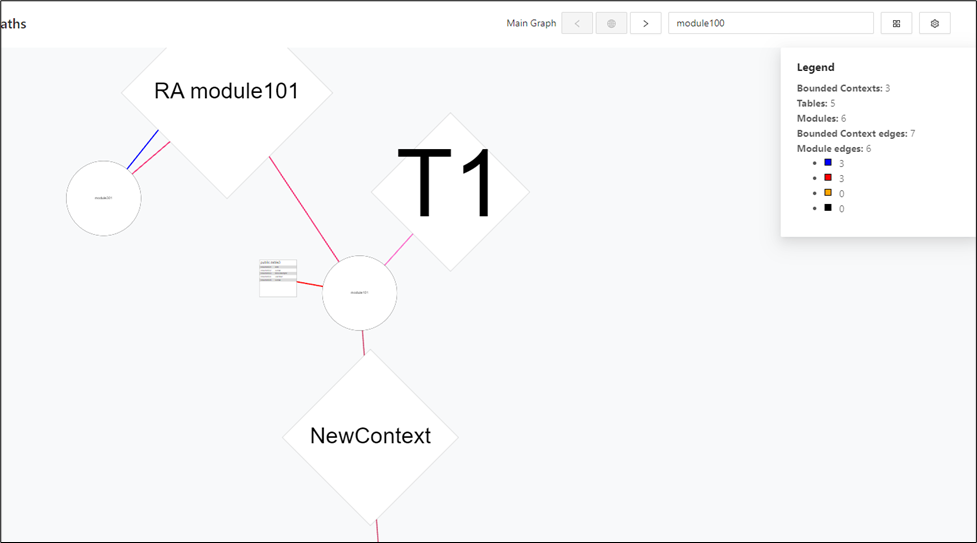
You can zoom in and out of the graph to inspect more bounded-context detail.
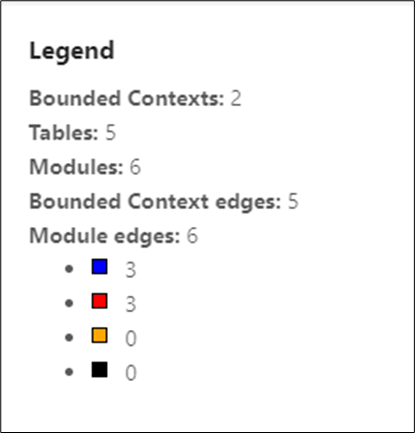
The legend shows the details of the Bounded Contexts along with the number of Read/Write queries, triggers.
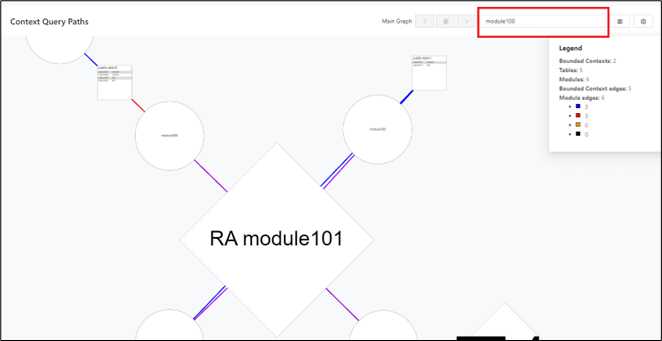
Use the search bar to find a specific module or table.
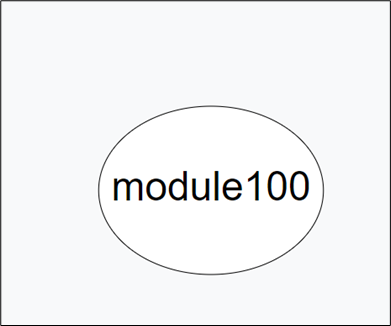
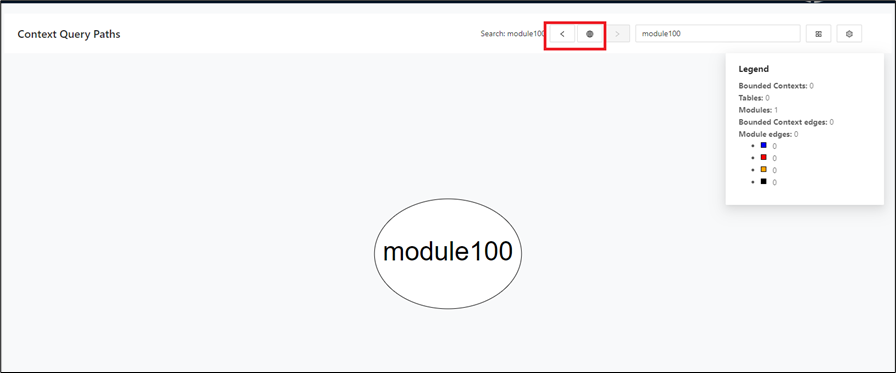
Use the back button or the return-to-main-graph button to navigate back to the main graph.
Assign modules to contexts
You can create new contexts and assign modules to the visible contexts from the Context Query Paths graph.
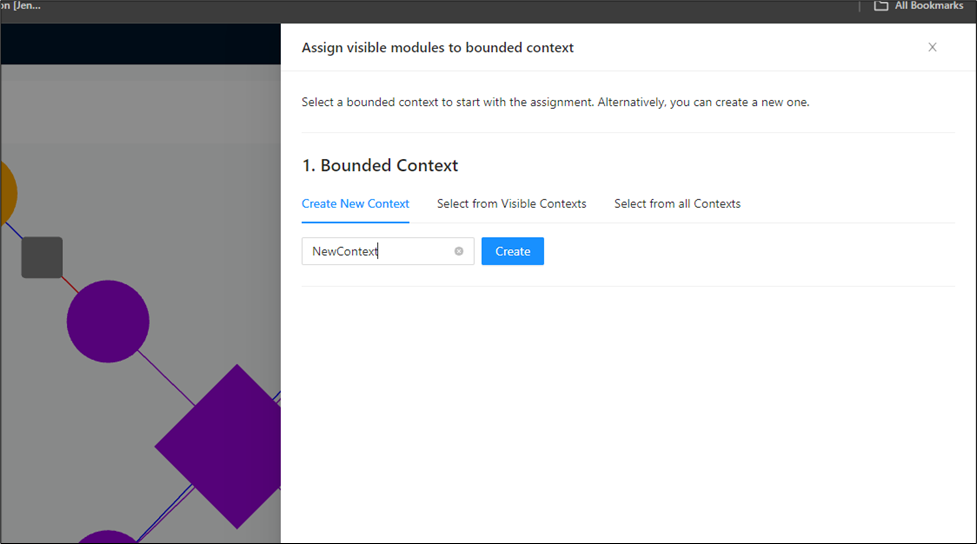
A new context can be created:
You can select a context from the existing contexts. This list does not include a context created in the previous step:
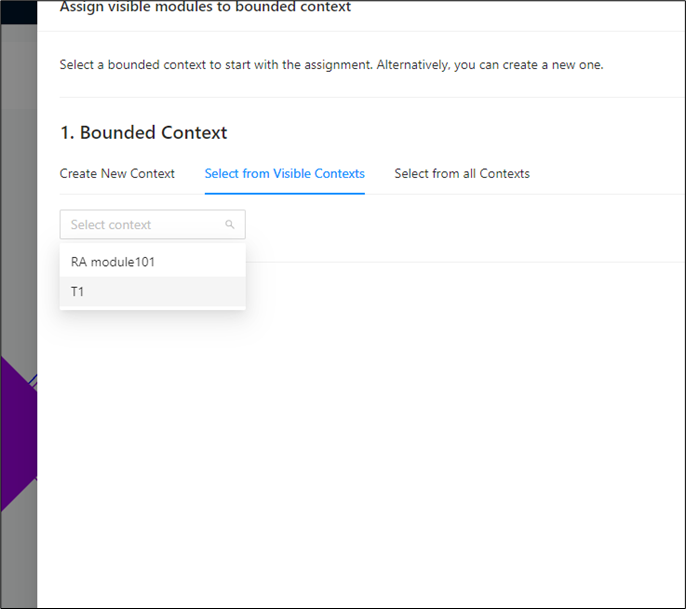
You can select a context from all contexts. This list includes a context created in the previous step:
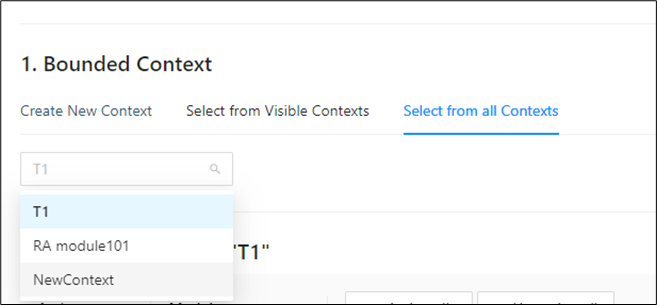
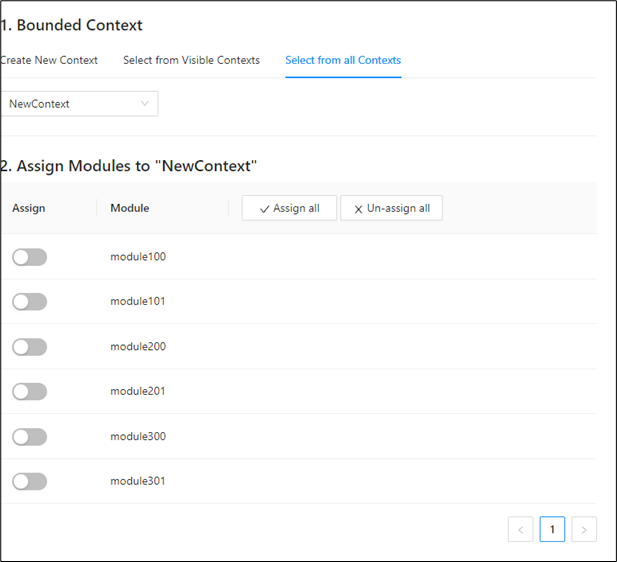
Assign modules to contexts individually by clicking the switches alongside the modules, or assign them all at once by using Assign All.
Unassign modules from contexts individually by clicking the switches alongside the modules, or remove them all at once by using Un-assign All.
After the assignment, the changes are visible in the graph.
Graph options
Use these options to change how the graph is displayed.
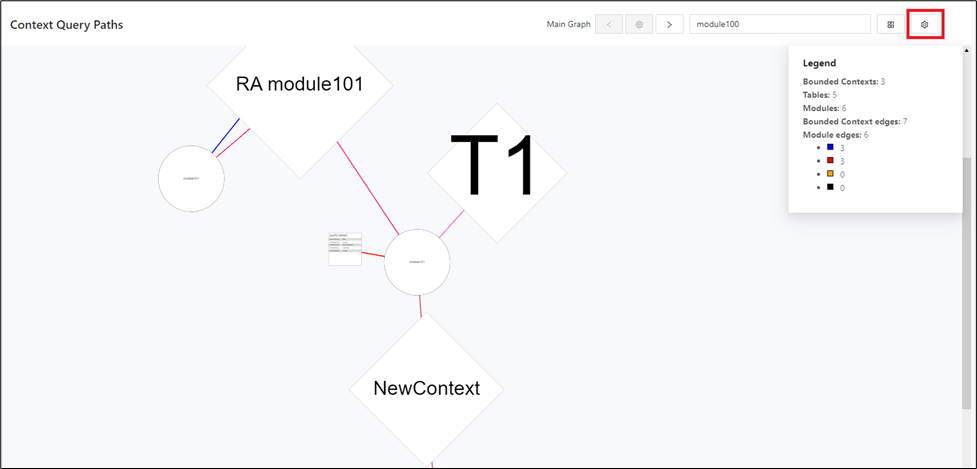
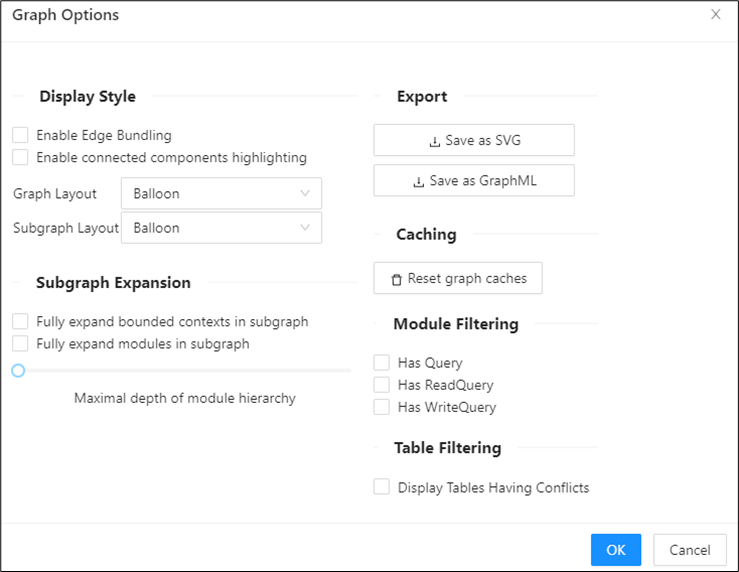
Display style: Highlights the connected edges.
Graph and subgraph layout: Displays the graph and subgraph in four orientations: Balloon, Hierarchical, Organic, and Radial.
Subgraph expansion: Controls how far the subgraph expands. More depth shows more information.
Export: Saves the graph as an SVG or GraphML file.
Caching: Resets caches to prevent incorrect graph display.
Module filtering: Filters the graph by read or write activity, or by query and no-query state.
Graph options for module filtering
-
Has Query
-
Description: Displays modules that have any type of query associated with them.
-
Use Case: Ideal for identifying modules that are actively engaged in querying operations.
-
-
Has ReadQuery
-
Description: Shows modules that specifically have read queries.
-
Use Case: Useful for analyzing modules that are involved in data retrieval operations.
-
-
Has WriteQuery
-
Description: Shows modules that have write queries.
-
Use Case: Best for examining modules that are responsible for data insertion or updates.
-
Table filtering filters tables with conflicts.
Display table options for conflict filtering
-
Display Tables Having Conflicts
-
Description: Visualization of conflicts, including the number of conflicts.
-
Use Case: Useful for identifying the overall conflict landscape.
-
Conclusion
Use the graph and table options to tailor the visualization and conflict analysis to your needs. The object count is displayed for each targeted module.