About Tracer
The About section in Tracer contains the conceptual pages that explain how Tracer collects runtime evidence, maps users to taxonomies, and calculates module affiliation probabilities. This page introduces the problem that Tracer solves and the high-level solution behind the feature. It explains why runtime evidence matters when static analysis alone cannot assign modules confidently to business domains. Read this section before configuring tracing data or reviewing probability outputs.
The problem statement:
It is difficult to determine which part of the codebase belongs to which taxonomy, but this knowledge is extremely useful for a successful migration from a monolithic legacy system to a modern application that is decomposed into domains and sub-domains.
Manual determination of the affiliation of a module to a taxonomy is very time consuming and error prone.
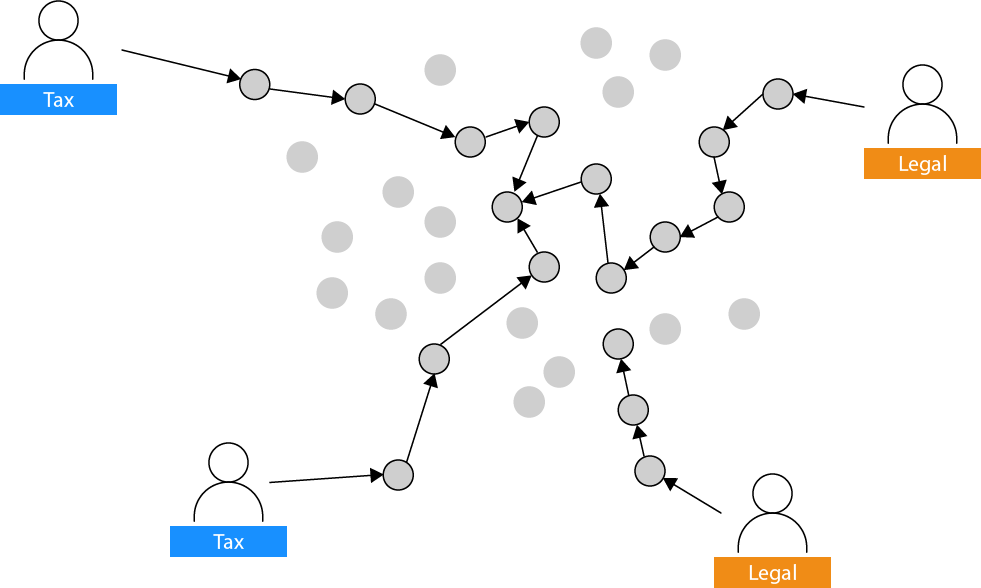
The solution approach:
Tracer follows the user through the system.
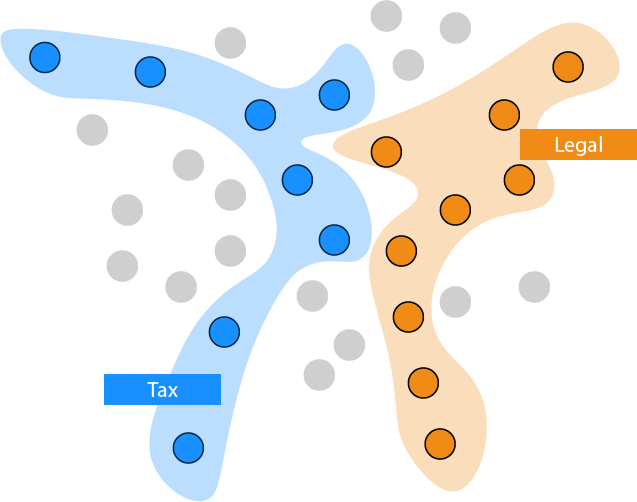
Combined with the knowledge which users is mapped to which taxonomy, Tracer can automatically determine the affiliation of a module to a taxonomy.
Application Overview
The Application Overview page explains the Tracer data model and the main entities that participate in the calculation flow. It shows how projects, users, taxonomies, modules, functions, and logs fit together in one analysis pipeline. Review this section when you need to understand what data Tracer expects and how the result calculation is derived.
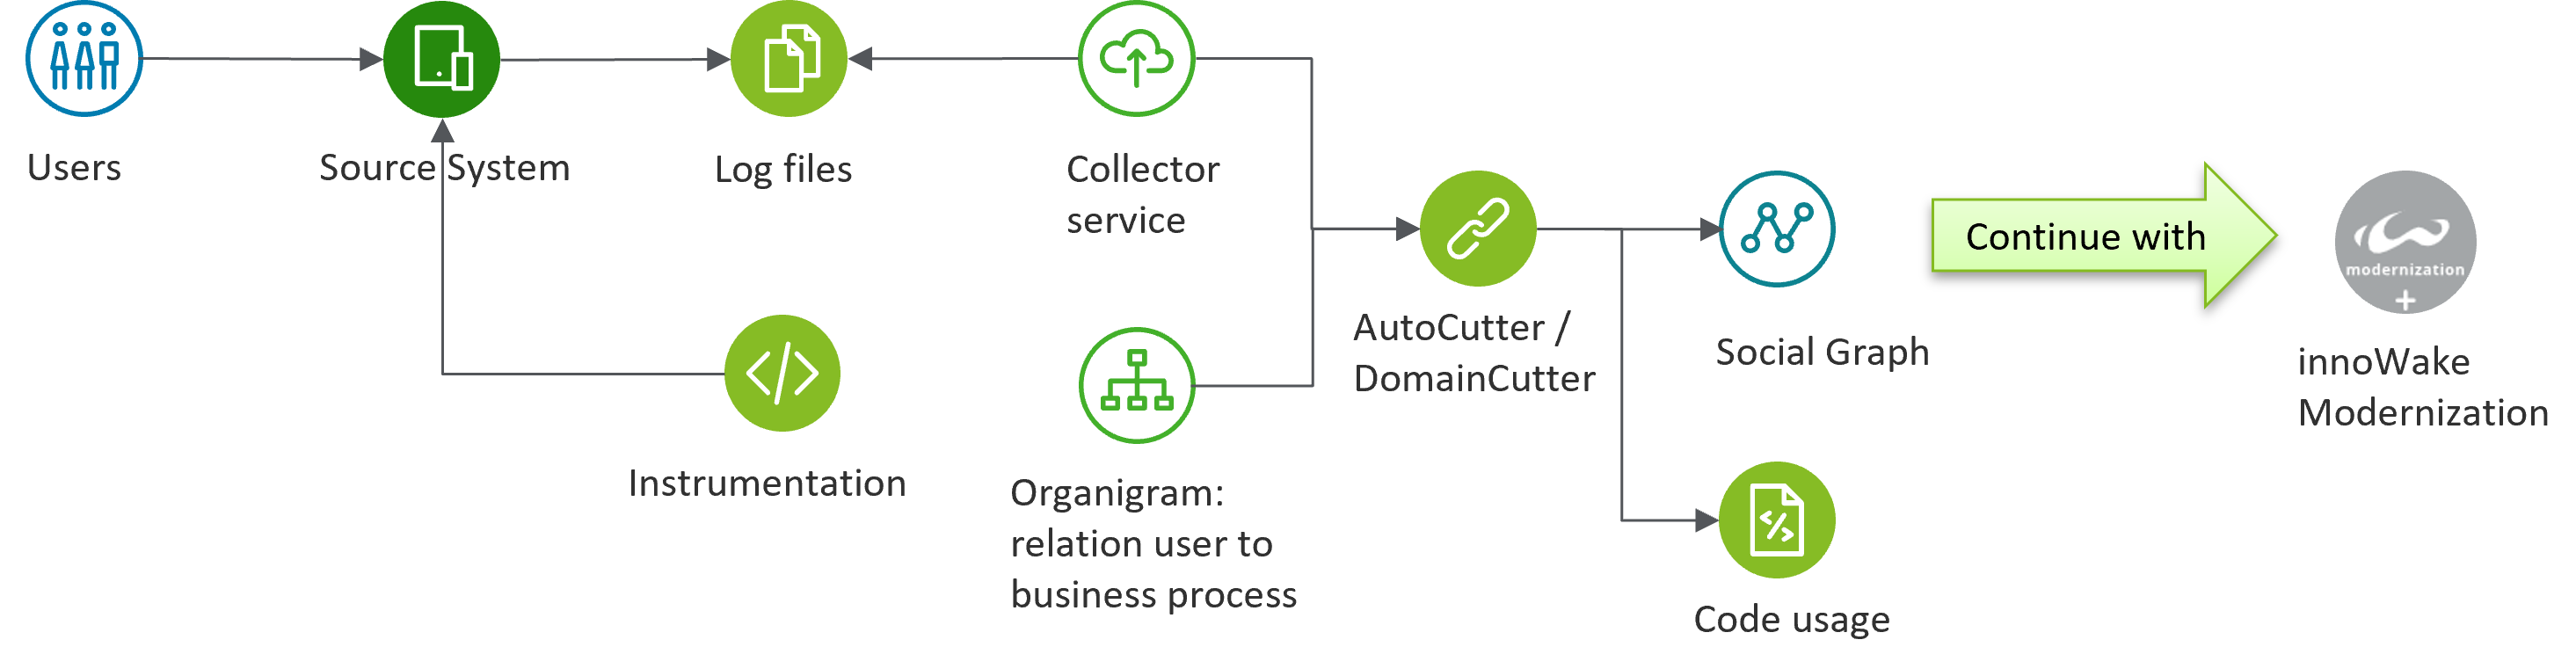
The Tracer architecture uses log files and organigrams to calculate each module's taxonomy affiliation.
| Topic | Description |
|---|---|
| Project | A Project is the top element of all other entities and contains assigned application details. New projects can be added on the project page. |
| User | Users, or more precisely actors, perform actions on a legacy application. Each user has at least one identification that can be found in the log files of the legacy application. Users can be identified automatically by the log file parser, or can be imported or manually input on the user input page. |
| Taxonomy | The knowledge about actual taxonomies does not exist within the static source code of the legacy application, therefore it must be given to the Tracer. Taxonomies can be defined manually, identified by the log file, or imported on the taxonomy input page. |
| Taxonomy Mapping | Now that we have the users and taxonomies of the application, we need to create a mapping from users to taxonomies. This mapping must be done manually, or by an import on the taxonomies-to-user mapping page. Alternatively the Tracer will automatically create new taxonomies for users or actors without mapping. |
| Mining Module | A module is a class or code file of an arbitrary programming language. Each taxonomy contains multiple modules and the modules may be shared between taxonomies. Modules can be defined manually, identified by the log, or imported on the mining module page. A static code analysis and discovery tool can easily provide the available modules within the legacy system. |
| Mining Function | A function is a method, procedure, or function of a module or class of an arbitrary programming language. Each module may contain multiple functions. Functions can be defined manually, identified by the log, or imported on the mining function rendering page. |
| Database Query | A database query is a database query of a module of an arbitrary programming language. Each module may contain multiple database queries. Database queries can be defined manually, identified by the log, or imported on the database query rendering page. |
| Result Calculation | With the help of application logs and the collector framework, Tracer can trace users through the application. To make use of the data, a calculation has to be started. This calculation identifies the modules used by each taxonomy and assigns a probability to each module. The probability indicates how likely the module is part of each taxonomy. A probability of 1.0 means that the module is certainly part of the taxonomy. A lower probability decreases the confidence that the module is part of this particular taxonomy.The result of the calculation can be found on the Taxonomy Usage report page. |
| Collector | To get the user flow from an application, the logs created by the application have to be processed. This is done in the collector component of the Tracer. The collector is responsible for parsing application logs and transforming them into an internal representation that can be used to reason about the data. The collector component already ships with supported log types: - COBOL logs - Java application logs - .NET application logs - Database query logs If you want to know how you can create the log files, visit the Data Gathering page. Once the logs are created, the collector needs to parse them accordingly. If you need to parse a custom format, visit the About Data Analysis page. |
Data Gathering
The Data Gathering page explains how Tracer follows module execution across a user flow and how it identifies unused or less-used modules. It focuses on how raw execution evidence is captured and why repeated usage matters for later probability calculations. Use this section to understand what kind of runtime activity produces useful Tracer results.
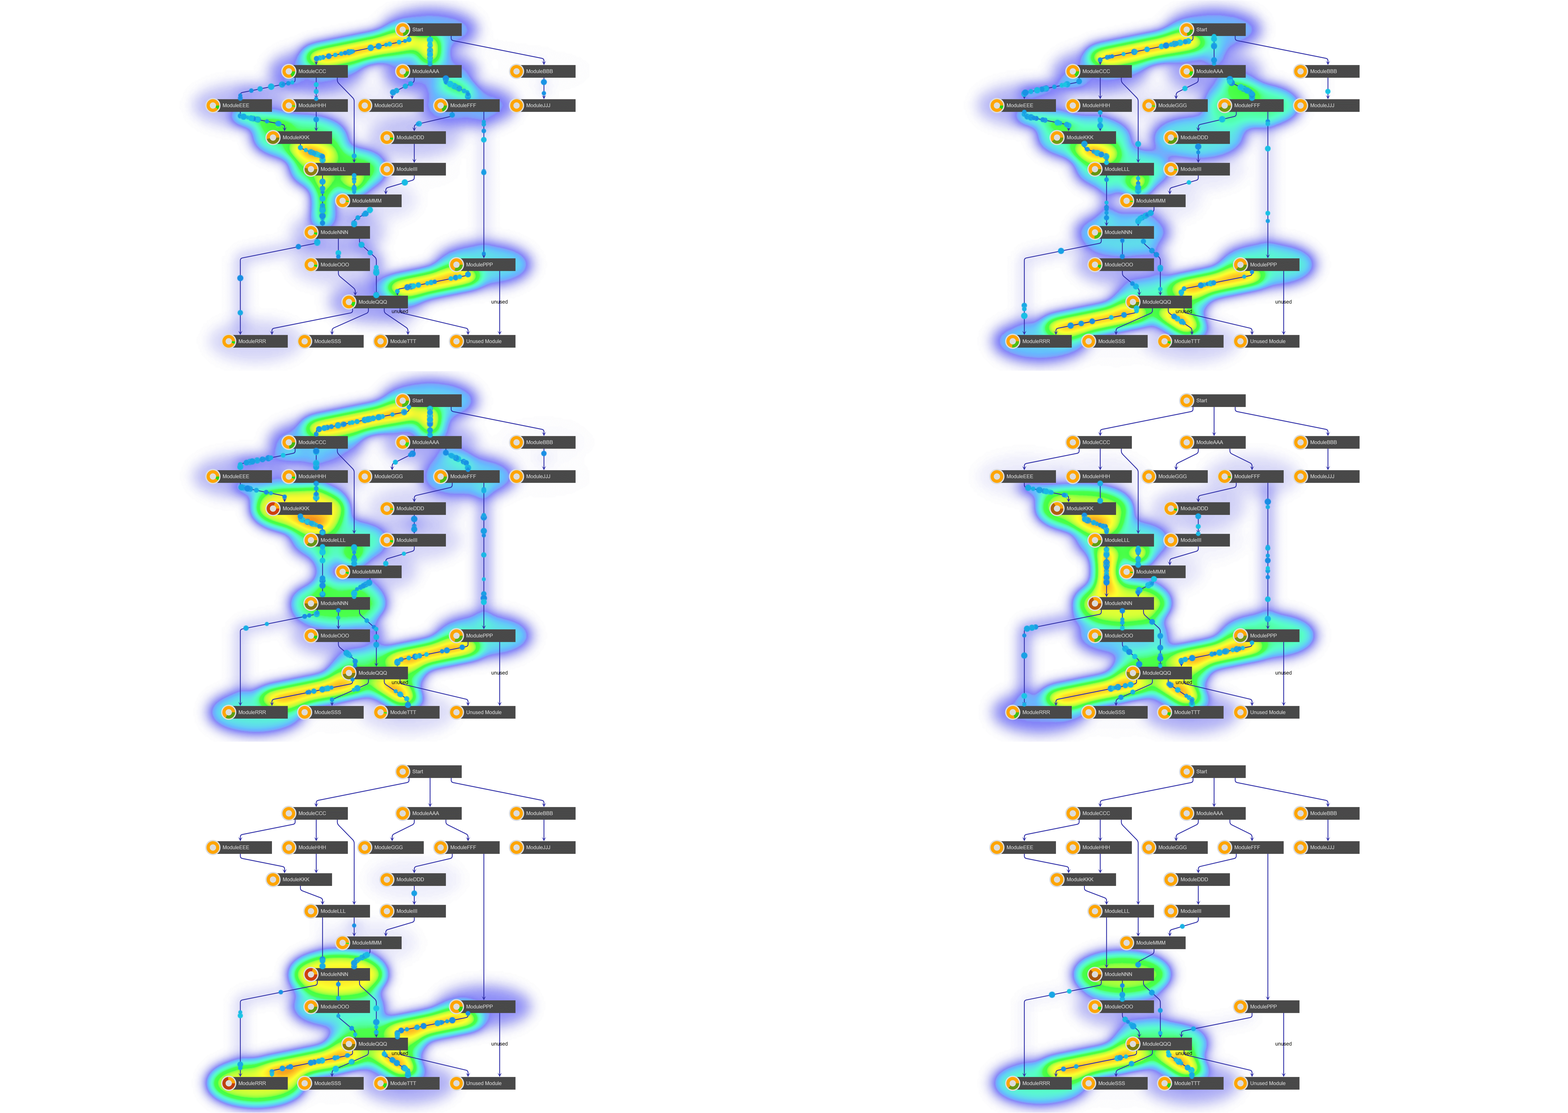
When an user starts working by starting an action in an user interface or in a batch process, the system will execute calls to modules, that will call other modules et cetera.
Not only is it possible to follow the user through the application, but the Tracer also takes into account how often a module is accessed. As a side effect, the Tracer also detects unused or less used modules.
Instrumentation
The Instrumentation page provides examples on how to instrument a legacy system so that it writes the log data required by Tracer. It is intended for teams preparing source systems to emit the runtime evidence that Tracer consumes. Use this section when you need practical guidance for COBOL, Java, .NET, or runtime-based tracing setup.
An obvious requirement for the Tracer is that we have access to a log file or another data source that contains the necessary information. The page provides examples on how to instrument the legacy application to write log files. As an alternative to the provided examples, you can also create a custom log writer and parser.
How to Instrument COBOL Applications
The script walks through all COBOL code and inserts in each call of each module a log message.
Download the instrumentation script
How to Instrument Java Applications
Run the agent together with your application. The agent will hoop into the Java VM and create the log files that are required for AutoCutter. The agent must be added as an option to the Java VM while starting the instrumented application.
Download the Tracer java agent
Download the Tracer java agent parameter file
How to Instrument .NET Applications
Run the agent together with your application. The agent will hook into the .NET application and create the log files that are required for Tracer.
Download the Tracer .net agent
How to Instrument the innoWake Runtime
Programs that are using the innoWake Runtime can use existing hooks in the runtime to write log messages.
Open Telemetry
The Open Telemetry page explains how OpenTelemetry Auto Instrumentation can be used instead of custom Tracer instrumentation. It is useful when you want to rely on a more standard observability stack while still producing trace data for Tracer analysis. Review this section if your environment already uses OpenTelemetry or you want to avoid custom logging agents.

Open Telemetry Instrumentation Overview
The Tracer architecture includes OpenTelemetry Auto Instrumentation, a widely used tool for generating, instrumenting, collecting, and exporting telemetry data, including metrics, logs, and traces.
OpenTelemetry Auto Instrumentation is available as libraries for various languages such as Python, Java, .NET, and NodeJS, and it does not require changes to the source code. The primary idea behind using OpenTelemetry Auto Instrumentation remains consistent with the approach previously described on the about tracer page, with the key difference being the method of log generation.
Instead of using custom Tracer instrumentation, OpenTelemetry Auto Instrumentation is employed. The advantage of this approach is that OpenTelemetry Auto Instrumentation is widely accepted and used by many companies.
Open Telemetry Agent Configuration
By default, OpenTelemetry Auto Instrumentation does not include user information in trace data, which is crucial for Tracer to analyze log files effectively.
To enable this, you need to configure the OpenTelemetry Agent by adding the appropriate environment variables, as demonstrated in the example configuration below. Additionally, the agent needs to know where to send telemetry data, so the Open Telemetry Collector Endpoint must be configured.
For more details on agent configuration, refer to the official OpenTelemetry documentation:
In the Tracer architecture described above, the Telemetry Service can generate output files for multiple source code apps simultaneously. This is achieved by adding the source code name to each span, which is configured using the OTEL_SERVICE_NAME environment variable, as demonstrated below.
Open Telemetry Collector Configuration
The Open Telemetry Collector provides a vendor-neutral solution for receiving, processing, and exporting telemetry data. It enhances scalability and supports a variety of open-source observability data formats, including Jaeger, Prometheus, and Fluent Bit, allowing seamless integration with both open-source and commercial backends.
In the Tracer architecture described above, the OpenTelemetry Collector functions as a telemetry message producer, using Kafka for exporting these messages. It preprocesses telemetry messages from the agent and sends them to Kafka with predefined topic names.
Below is a sample configuration for the OpenTelemetry Collector. It is important to ensure that the Kafka exporter protocol version matches the Kafka version in use, and that the encoding is set to the Jaeger JSON format.
Telemetry Service
The Telemetry Service generates input log files on a scheduled basis for Tracer by subscribing to telemetry Kafka topics produced by the Open Telemetry Collector.
Download the Tracer sample logs
About Data Analysis
The About Data Analysis page explains how to extend the collector with a custom parser for a custom log format. It is intended for cases where the shipped collectors do not match the logging format used in your legacy environment. Use it when you need to adapt Tracer to a non-standard source of runtime evidence.
How to Write a Custom Log Processor
The Tracer extracts information about the usage of the code modules of a legacy system from its log files. It calculates how often a user has accessed a module. Combined with the knowledge about the taxonomy that the user is typically working on, the Tracer can derive probabilities of the affiliation of a module to a taxonomy.
The Tracer relies on the information found in log files of legacy systems, or similar systems, like Application Performance Monitoring. While the collector application provides standard implementations for some log files, it is also possible to extend it with custom parsers for custom log files of any type.