Tracer
Tracer helps you use runtime evidence to understand how users move through a legacy application. It combines traced users, taxonomy mappings, uploaded logs, and module usage so you can identify candidate domains and focus later decomposition work.
Tracer workflow
The Tracer workflow is easiest to follow when you move from concepts, to master data, to log ingestion, and finally to reports. Each step builds on the previous one, so missing setup in an earlier page usually affects downstream analysis results. Use the sequence below as the recommended order for onboarding a new project into Tracer.
Use Tracer in this order:
- Review About Tracer to understand the tracing model, instrumentation options, and analysis approach.
- Add or import Traced Users.
- Create, merge, or import entries in Taxonomy Selection.
- Create the mappings in Taxonomy User Mapping.
- Upload runtime, database query, or OpenTelemetry logs on Upload Logfile.
- Review Mining Modules and the Tracer Reports to understand usage patterns and taxonomy probabilities.
About Tracer
The conceptual overview for Tracer now lives on the dedicated About Tracer page. The page explains the Tracer model, application overview, data gathering, instrumentation, OpenTelemetry, and data analysis topics in more detail. Start there if you need the background behind the runtime evidence and probability calculations used elsewhere in this section.
Traced users
The Traced Users page stores the users or actors that Tracer associates with runtime activity. These entries are foundational because Tracer uses them to connect observed system behavior to business-facing user groups. Maintain this page before loading logs so the resulting activity can be mapped meaningfully.
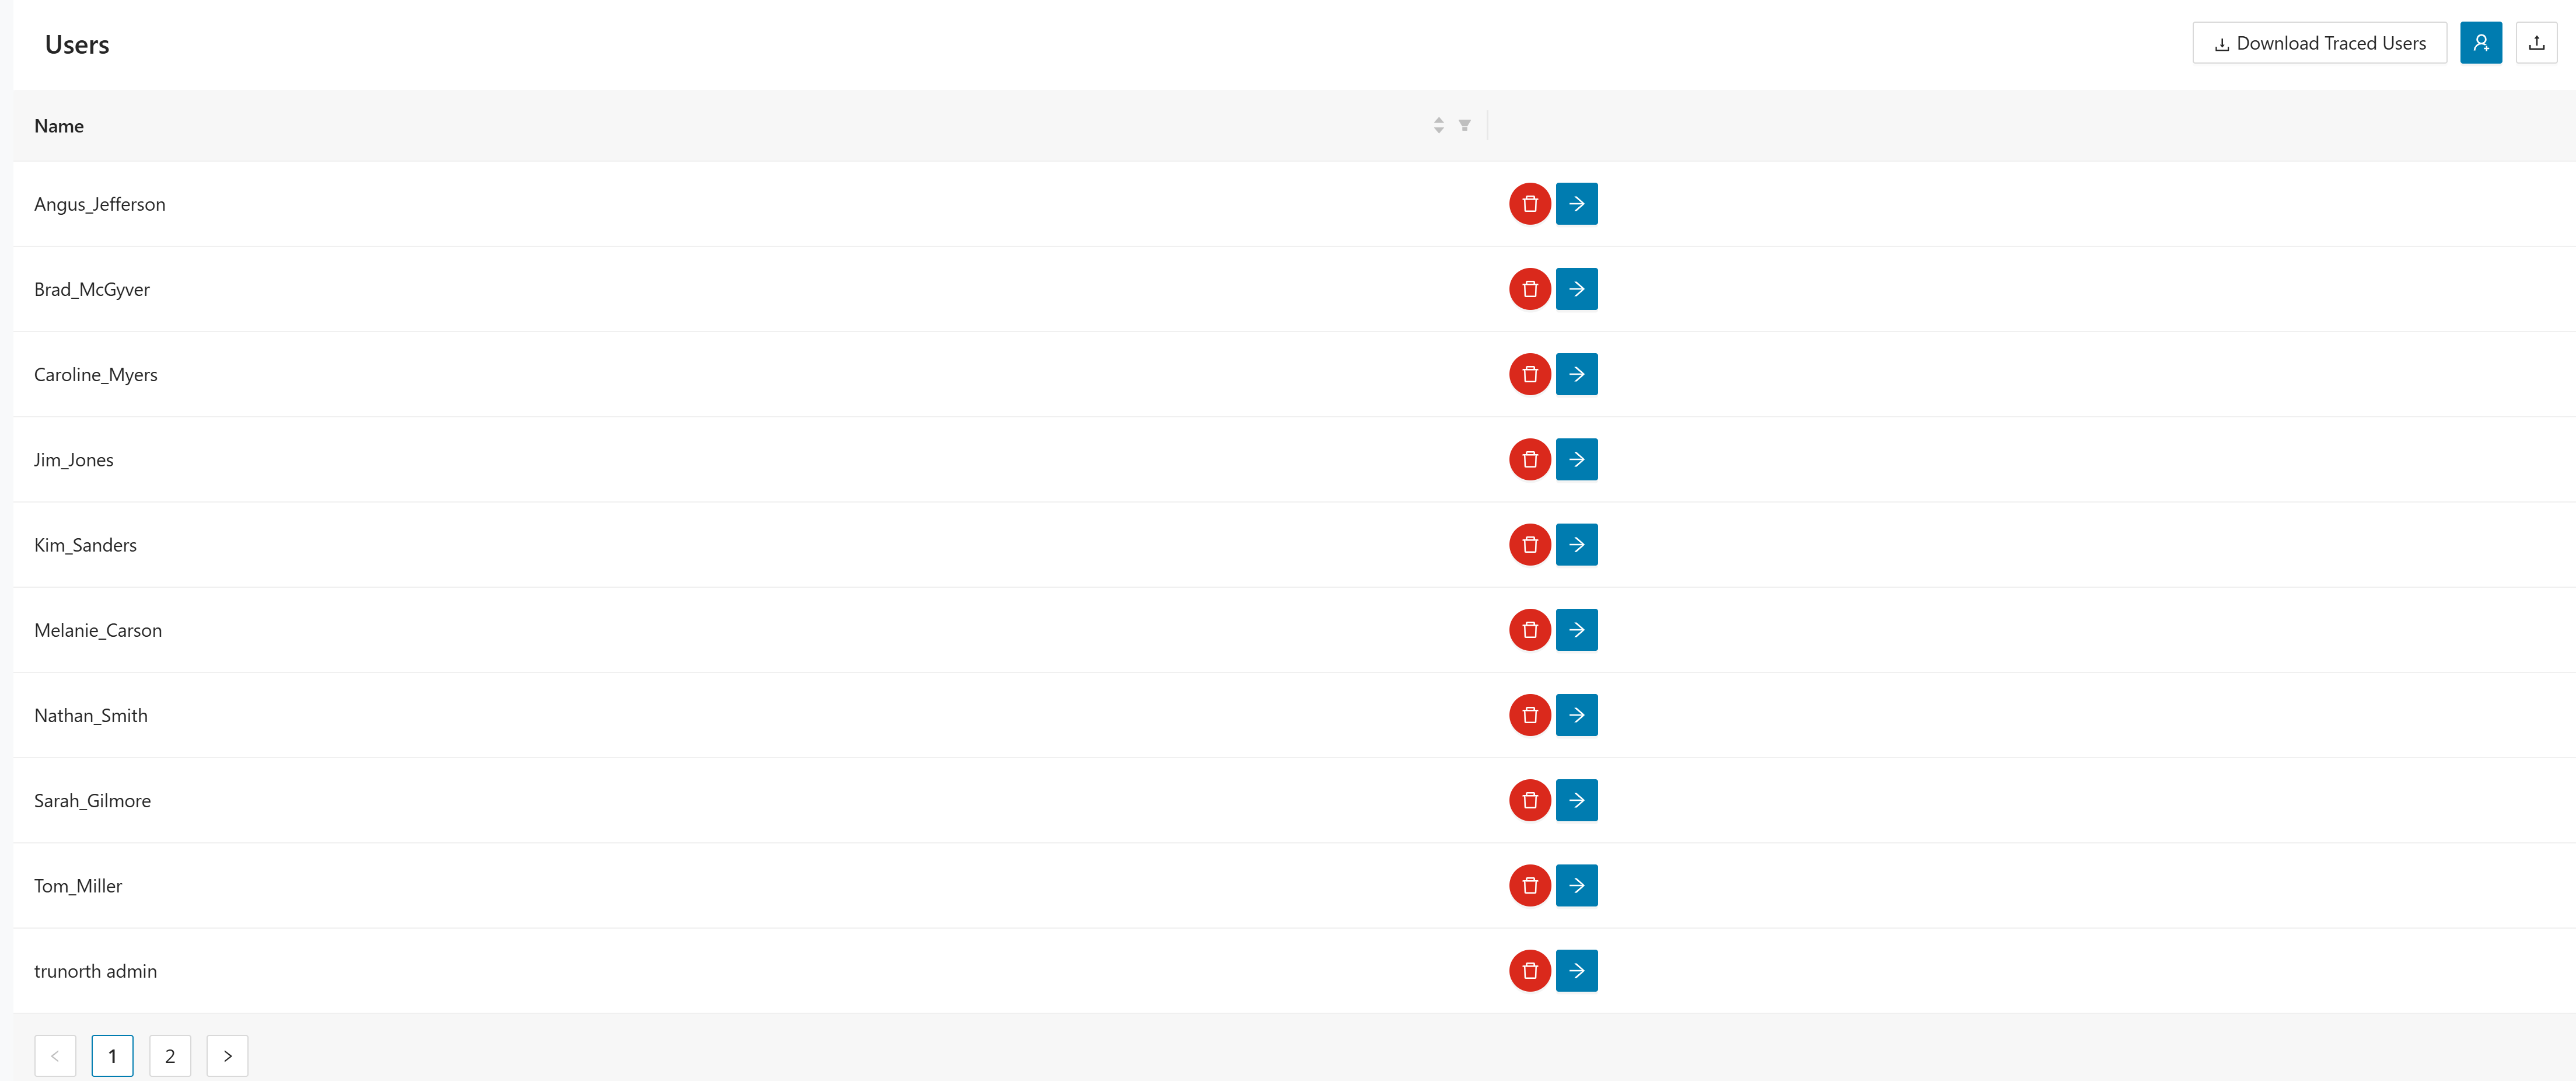
The page accepts CSV uploads.
Use the controls in the upper-right corner of the page to work with traced users:
- Click Download Traced Users to export the current user list.
- Click to create a traced user manually.
- Click to import users from a file.
Managing traced users
Use these actions to create and maintain traced users.
- Click .
- Enter the value in User name.
- Click
to create the user and return to the user list.

- Click to delete the user. The application asks for confirmation before the delete is applied.
- Click to open User Identities for the selected user.
- Maintain the identities associated with that traced user on the User Identities page.
Taxonomy selection
Use Taxonomy Selection to maintain the business taxonomies that Tracer uses during analysis. These taxonomies represent the candidate business domains that Tracer will compare against runtime behavior. Define them carefully so the later probabilities align with the business structure you want to evaluate.
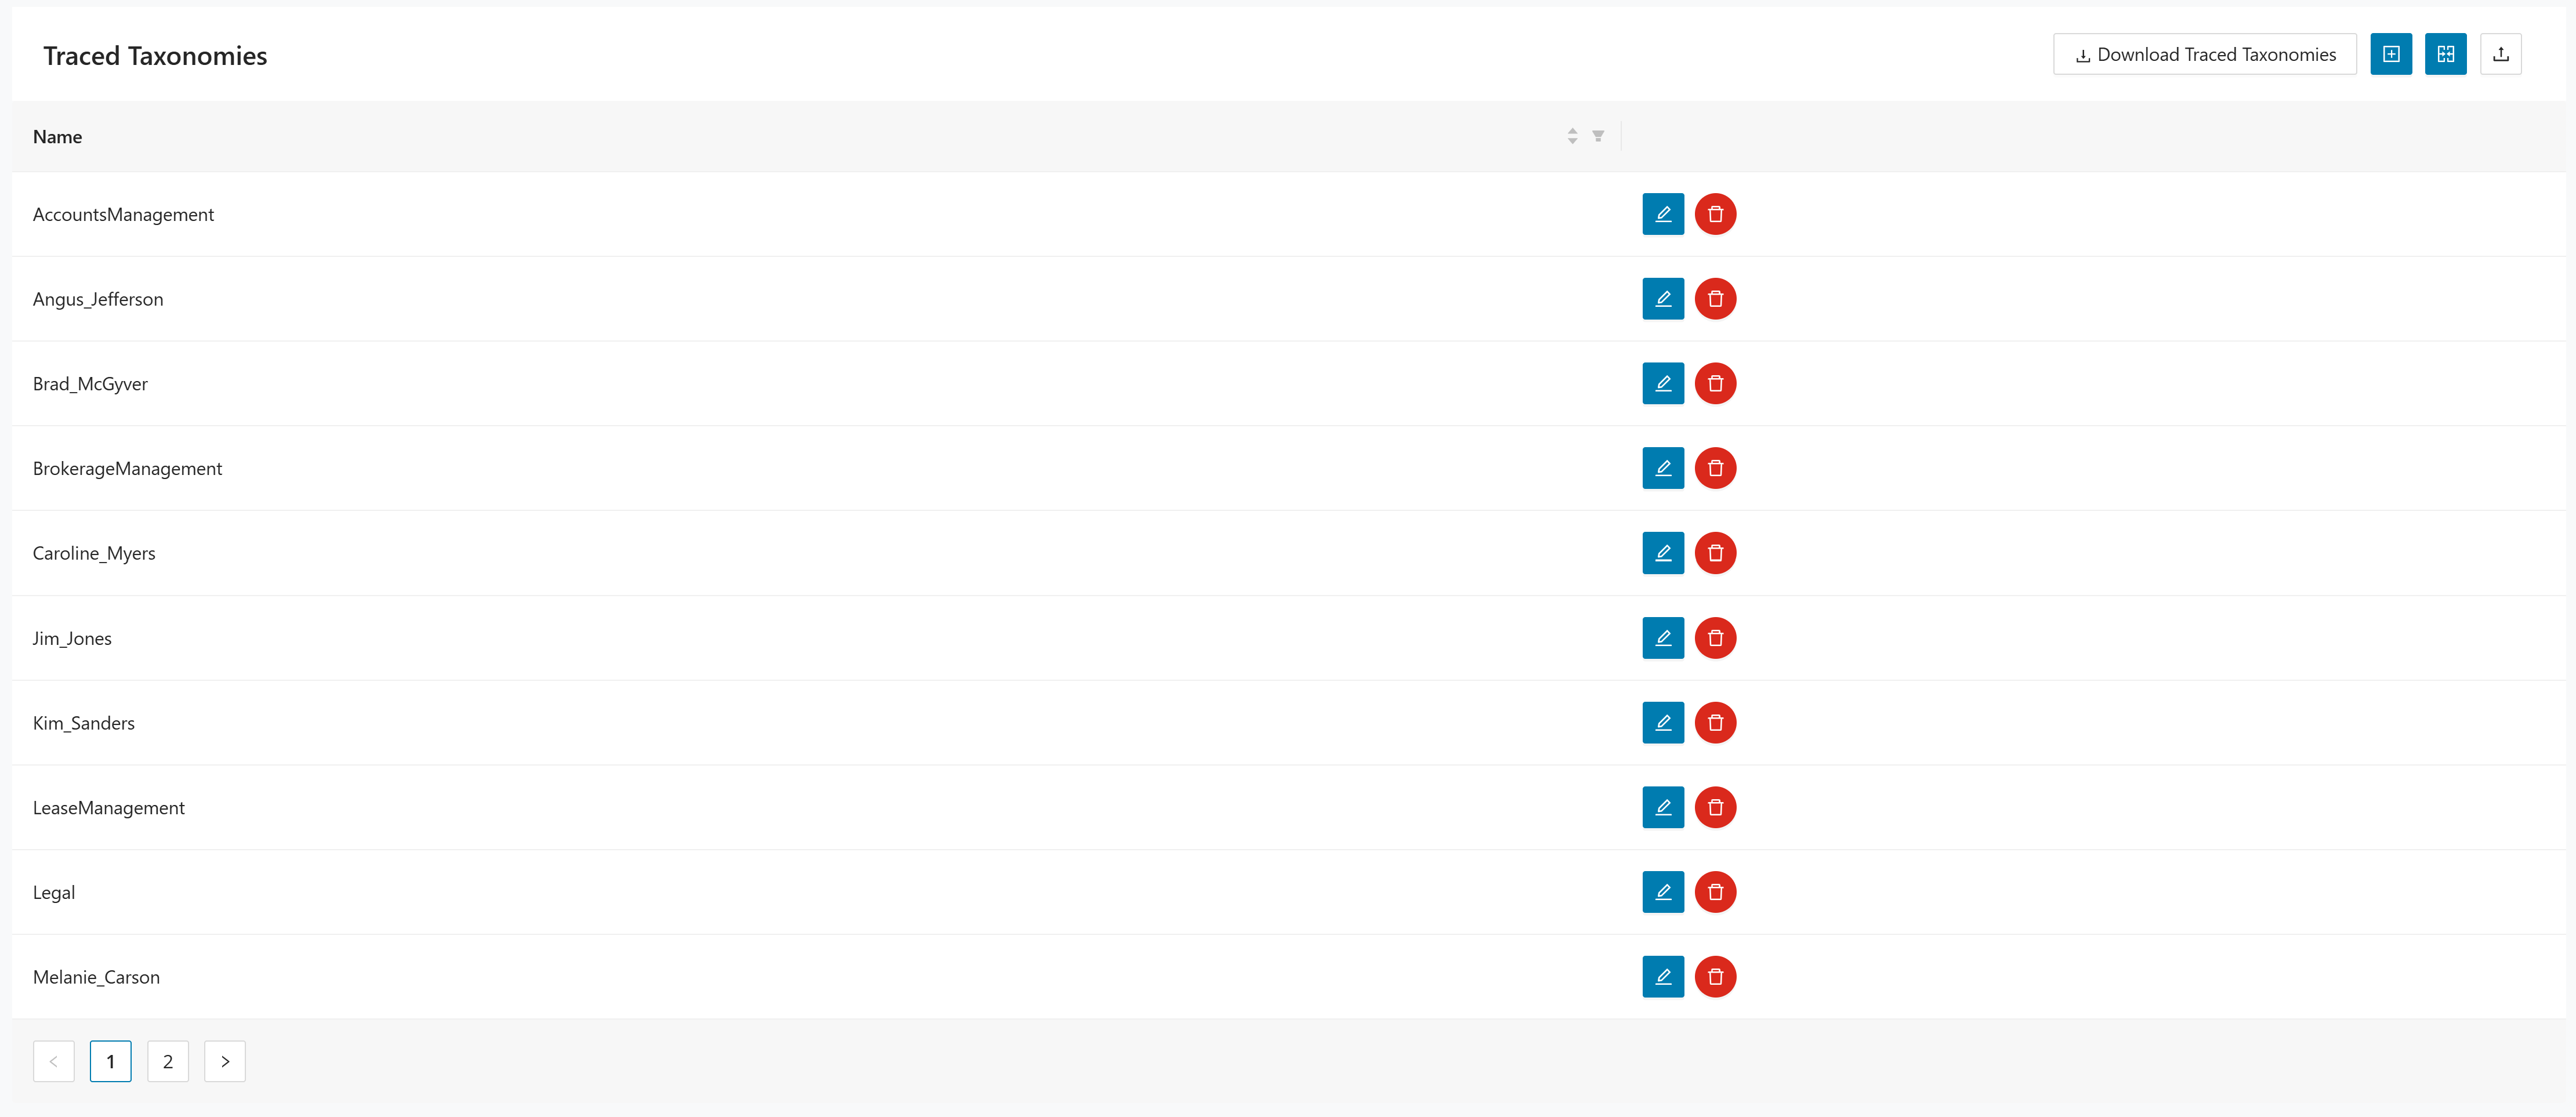
The page accepts CSV uploads.
The toolbar provides the following actions:
- Click Download Traced Taxonomies to export the current taxonomy list.
- Click to create a taxonomy manually.
- Click to combine two taxonomy entries.
- Click to import taxonomy data.
Managing taxonomies
Use these actions to create, merge, and maintain taxonomy entries.
- Click .
- Enter the value in Taxonomy Name.
- Click
to create the taxonomy and return to the taxonomy list.

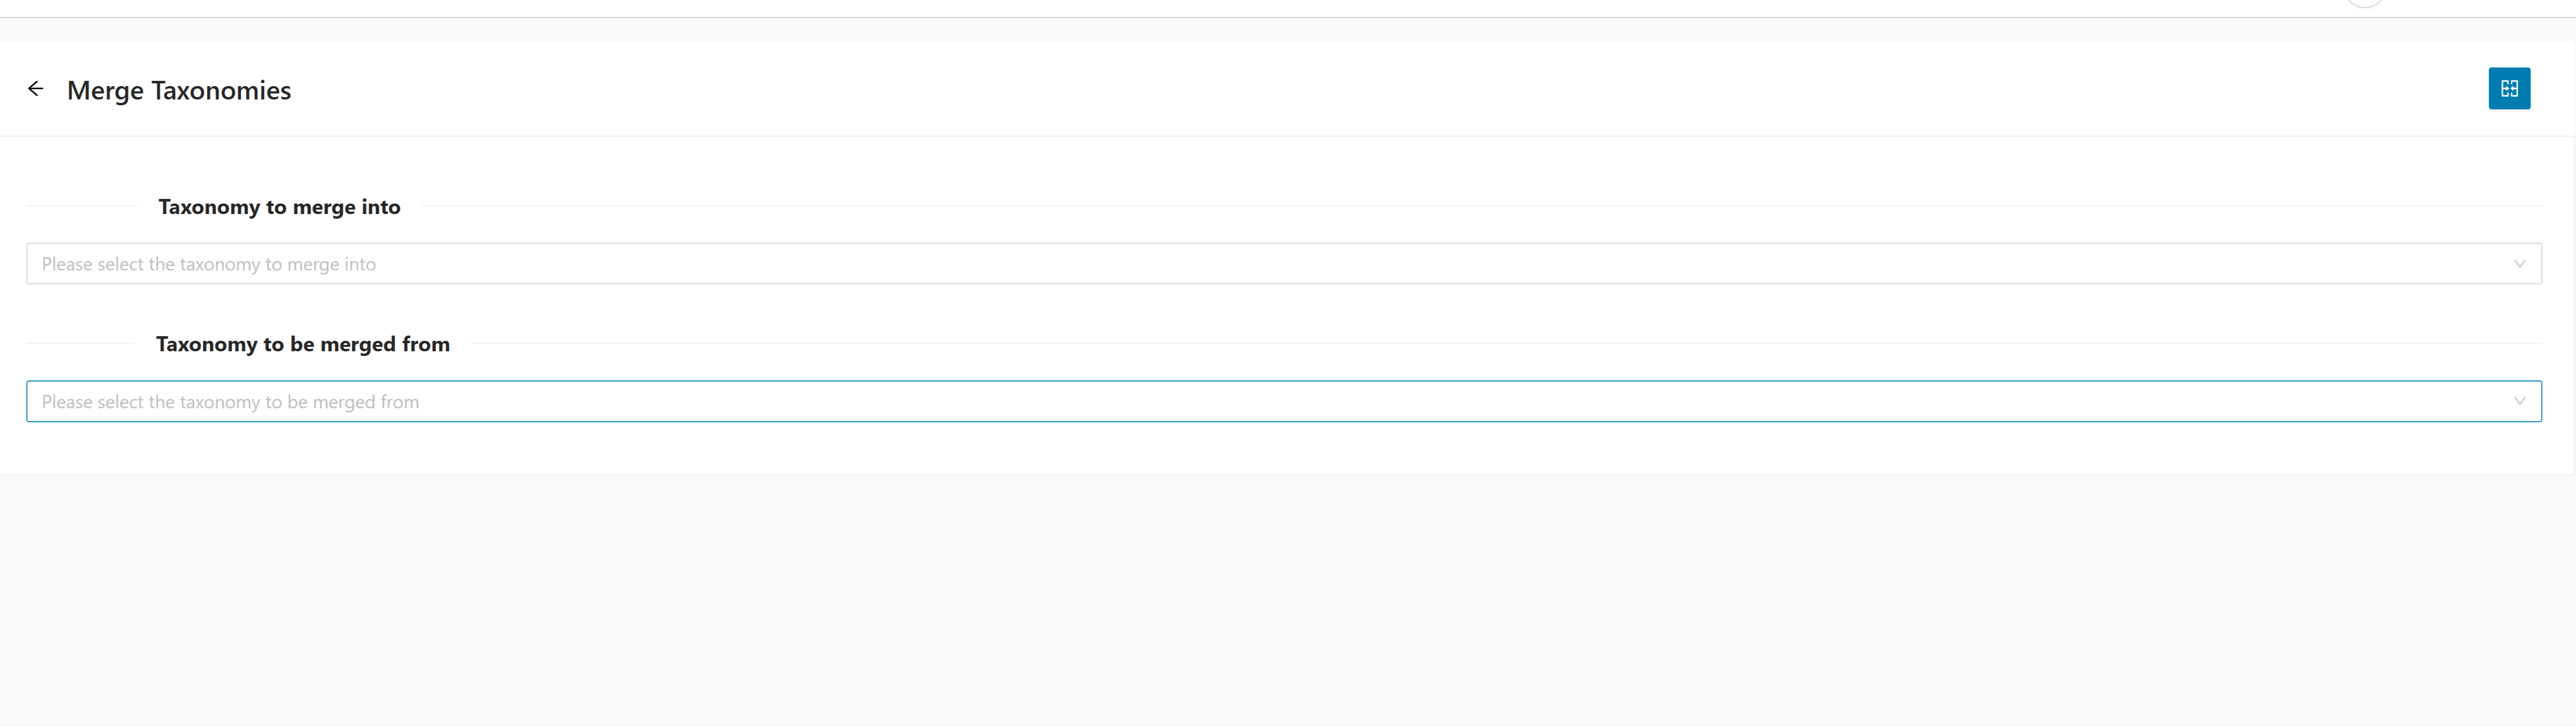
- Click .
- Select the target taxonomy in Taxonomy to merge into.
- Select the source taxonomy in Taxonomy to be merged from.
- Click
to merge the selected taxonomies.
- Click to open Edit Taxonomy. The page prepopulates Taxonomy Name for the selected entry.
- Update the taxonomy name and click to apply the change.
- Click to delete the taxonomy. The application asks for confirmation before the delete is applied.
Taxonomy user mapping
Use Taxonomy User Mapping to connect users to the taxonomy they represent. Tracer depends on this mapping to turn raw user activity into module-to-taxonomy probabilities. Keep it accurate because incorrect mappings can distort the analysis results significantly.
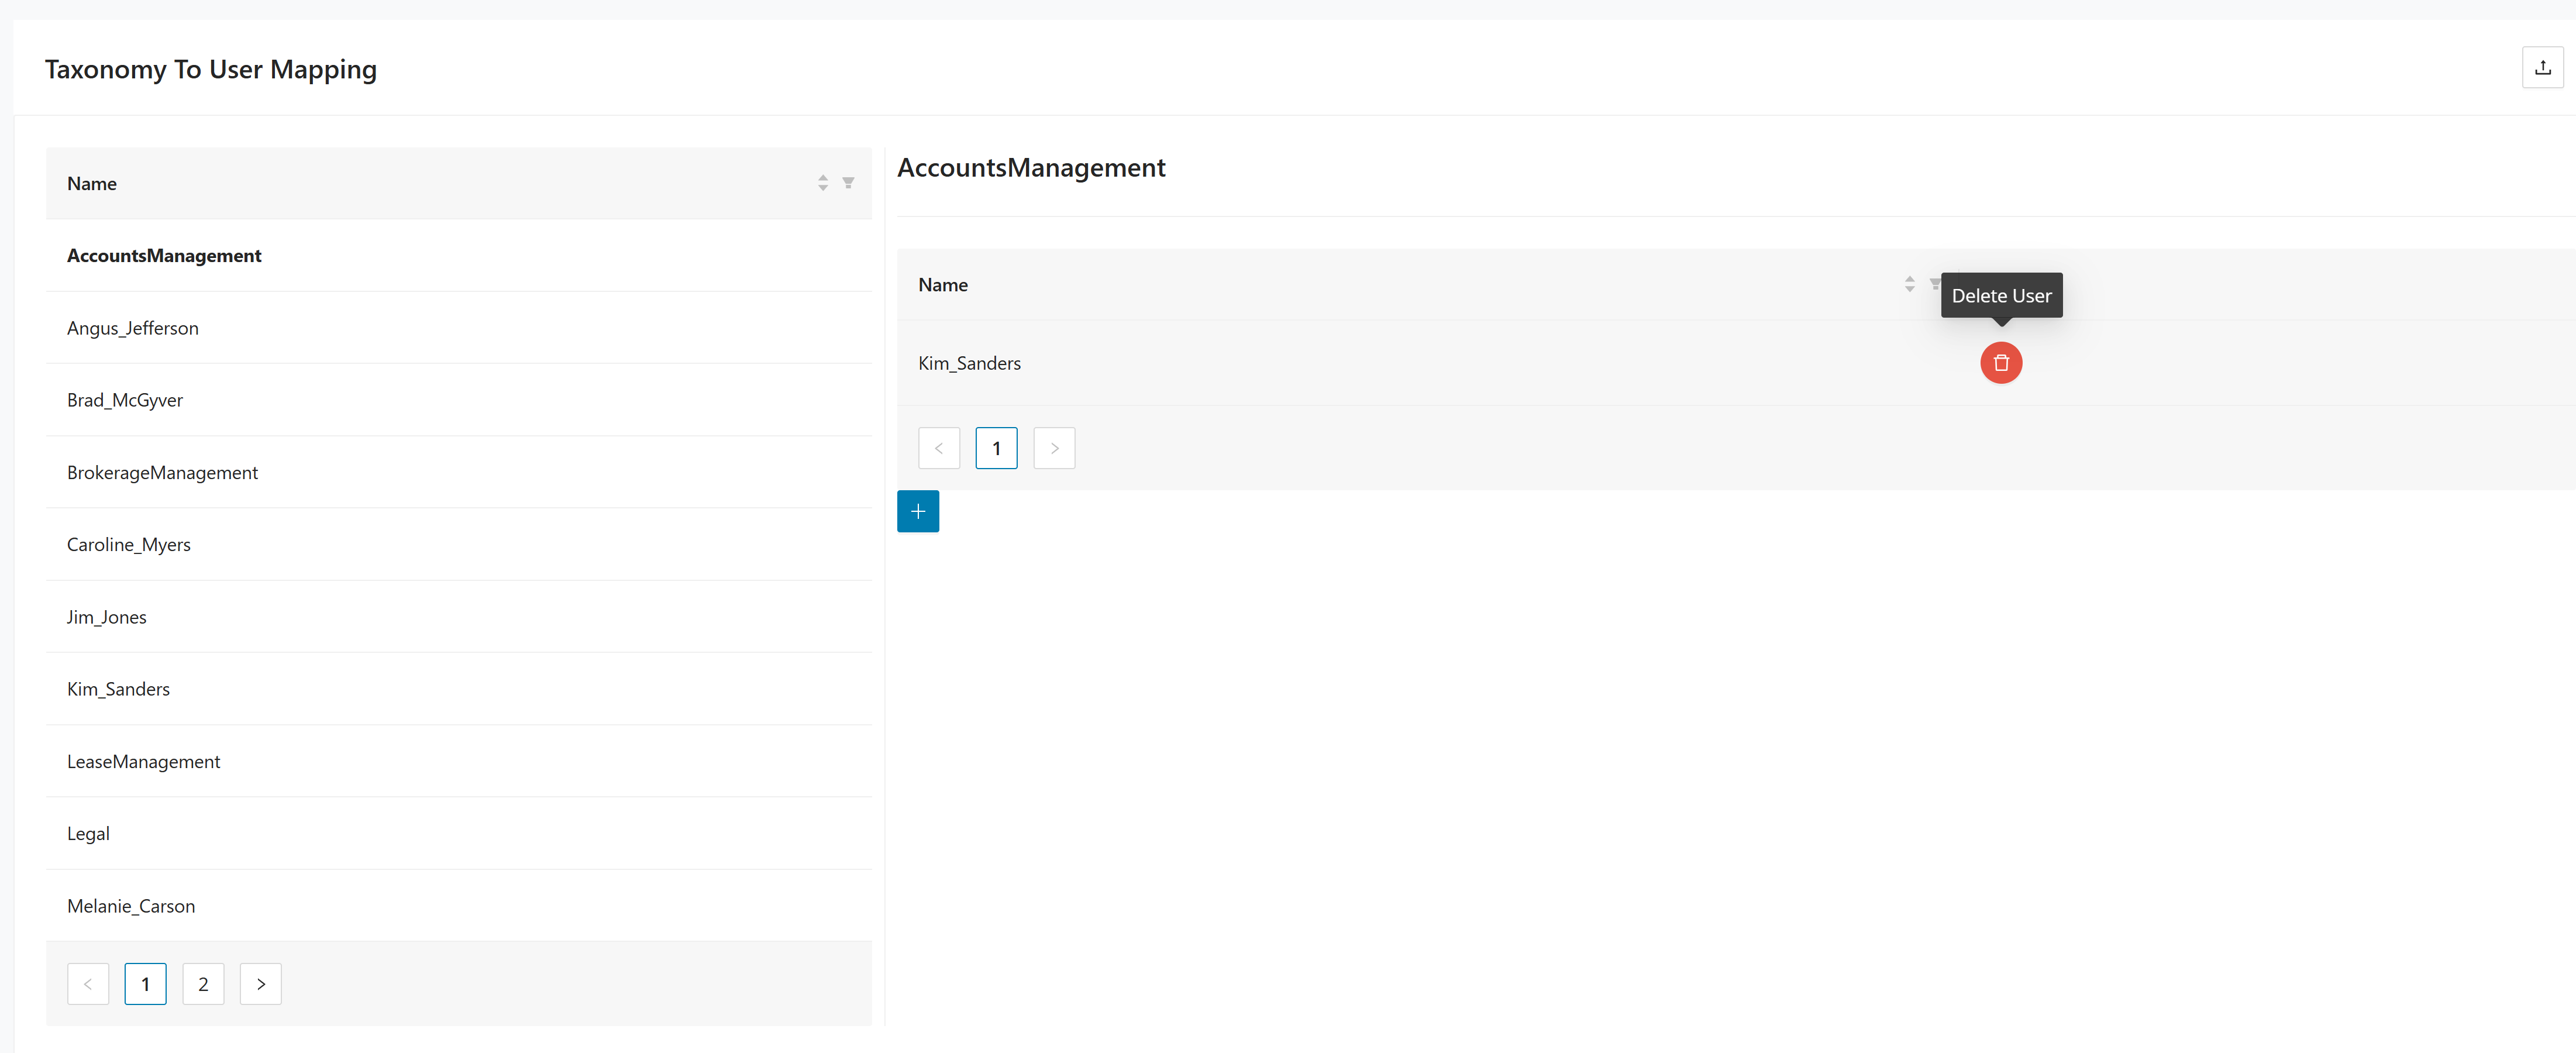
Use a CSV file when you import mappings on this page. A valid file uses the headers UserName;TaxonomyName.
The page is split into two lists:
- The left side shows available taxonomies.
- The right side shows the users mapped to the selected taxonomy.
Use the controls on this page as follows:
- Select a taxonomy from the list on the left.
- Review the mapped users for the selected taxonomy in the right panel.
- Click Add mapped users for the selected taxonomy to open Create Taxonomy To User Mapping.
- Select the user from the dropdown to map on the creation page and click to add the mapping.
- Click near the page title to import mapping data from a CSV file.
The Add mapped users action is context-sensitive. It works on the taxonomy that is currently selected in the left panel and opens a dedicated mapping page for that taxonomy.
Managing taxonomy user mappings
Use these actions to add, import, and remove taxonomy user mappings.
- Select a taxonomy from the list on the left.
- Click Add mapped users for the selected taxonomy.
- Select the user to map on the creation page.
- Click
to add the mapping.

- Click near the page title.
- Select a CSV file that uses the headers
UserName;TaxonomyName. - Complete the import to load the mappings into the page.
- Select a taxonomy from the list on the left.
- Review the mapped users in the right panel.
- Click in the mapped-users table to remove the selected user from that taxonomy.
Mining modules
The Mining Modules page lists the modules discovered by tracing and shows the module metadata available for later reporting and decomposition. It gives you a direct view of the technical artifacts Tracer has identified from the collected evidence. Use it to confirm coverage, inspect module details, and control inclusion in later results.
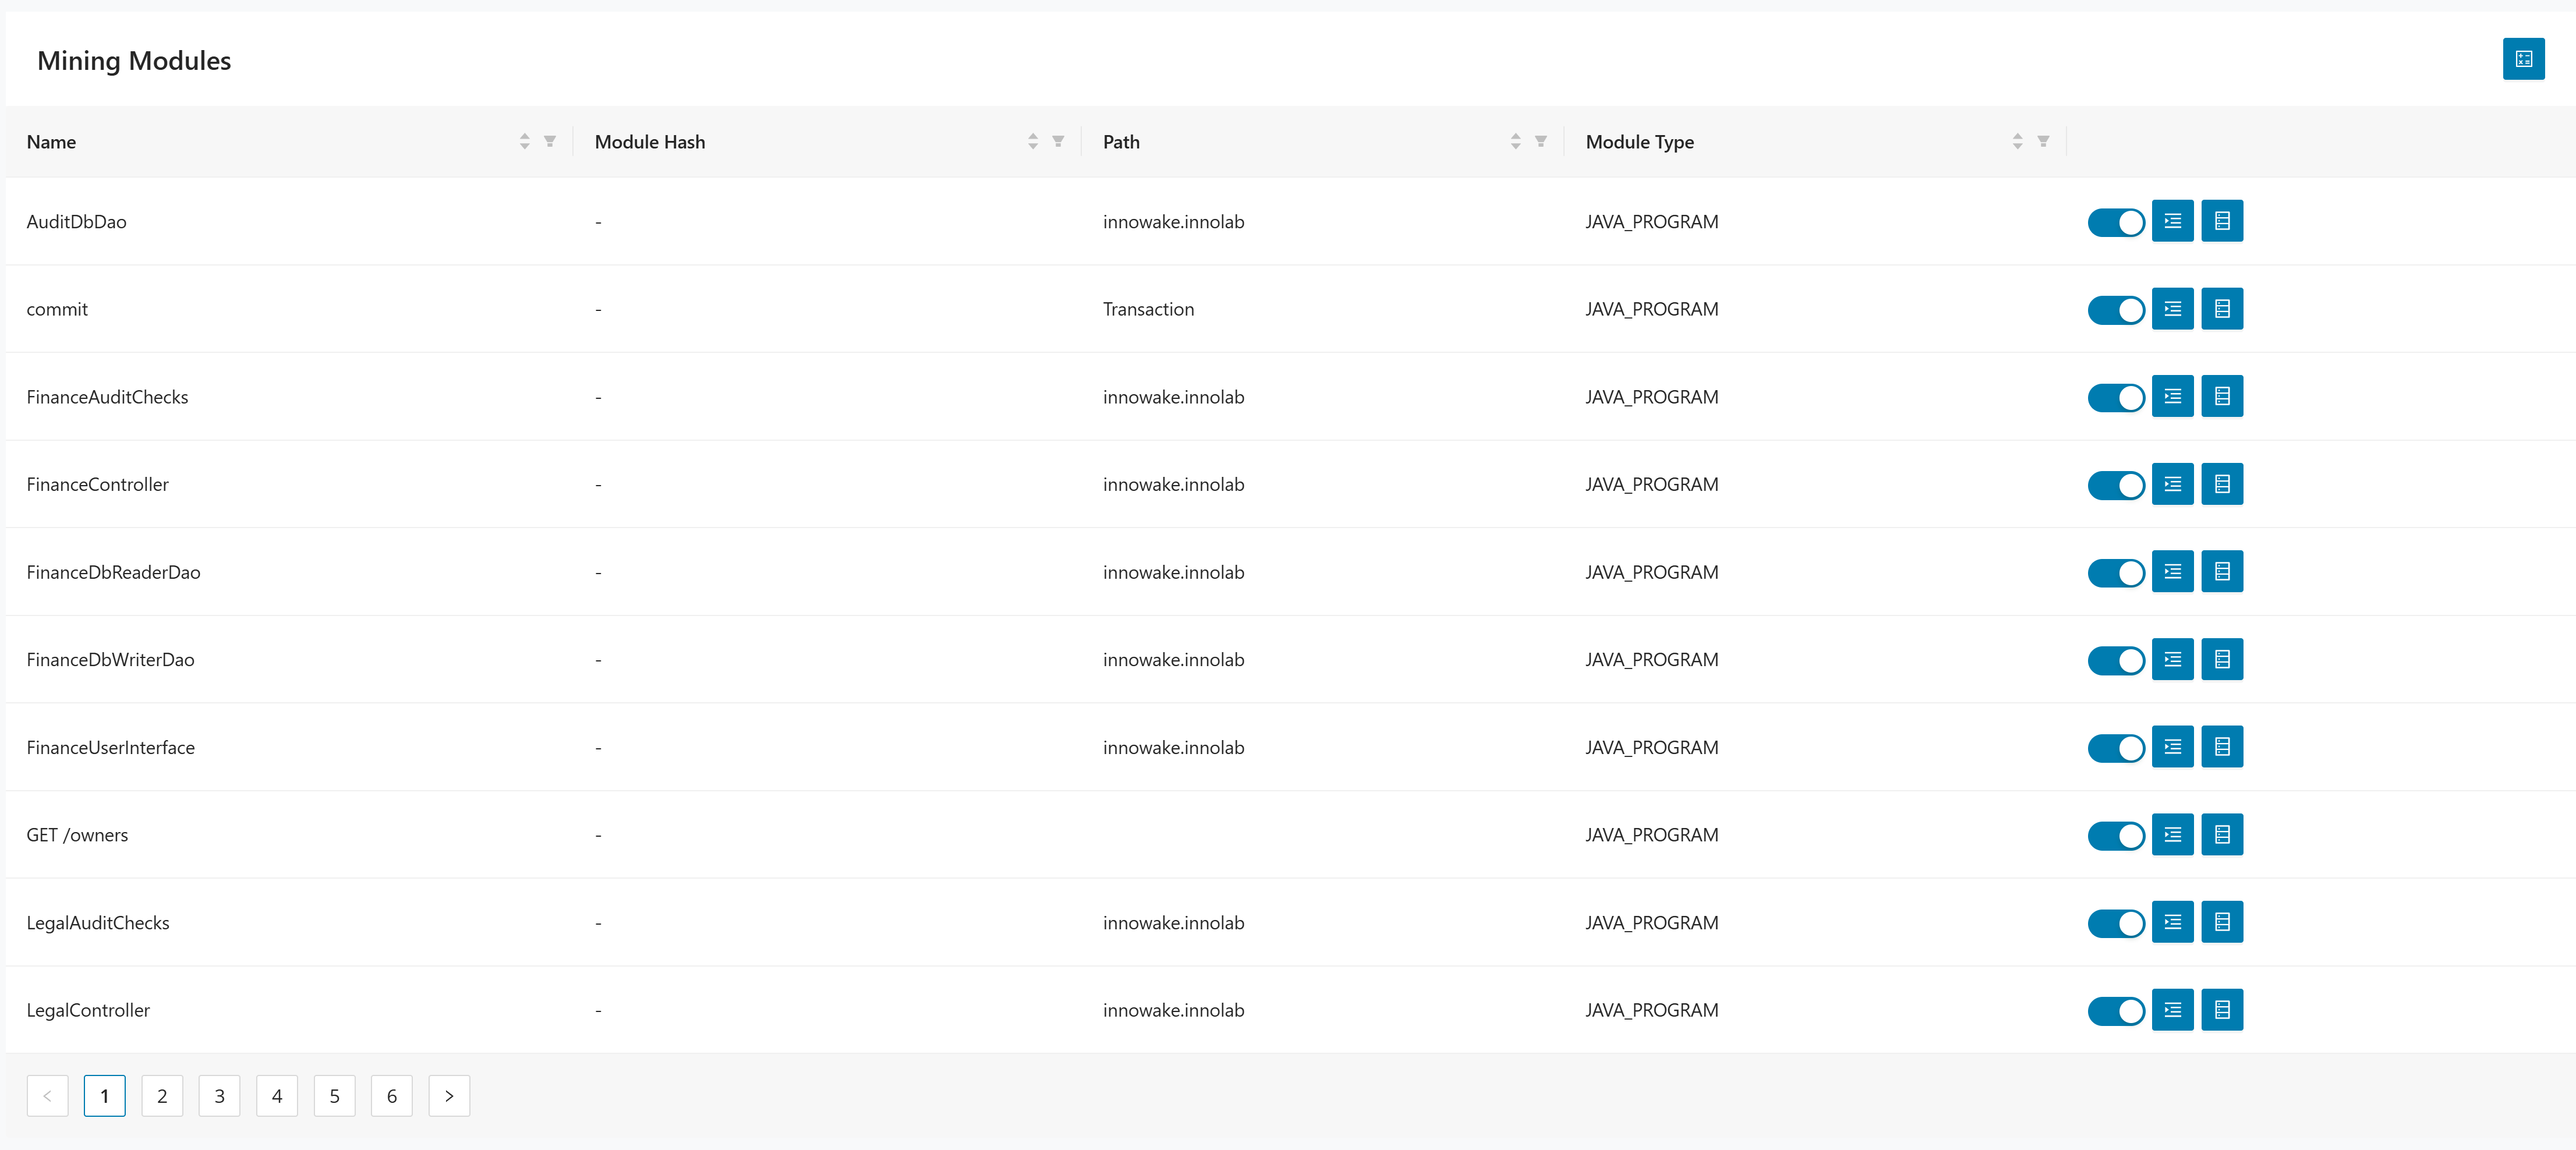
The table includes these columns:
- Name identifies the module.
- Module Hash shows the unique technical identifier for the module.
- Path shows the source or logical path when available.
- Module Type identifies the type of module, such as
EXEC_PGM,FILE,PROC, orSUBROUTINE.
Using mining module actions
Use these actions to include modules in results and review related details.
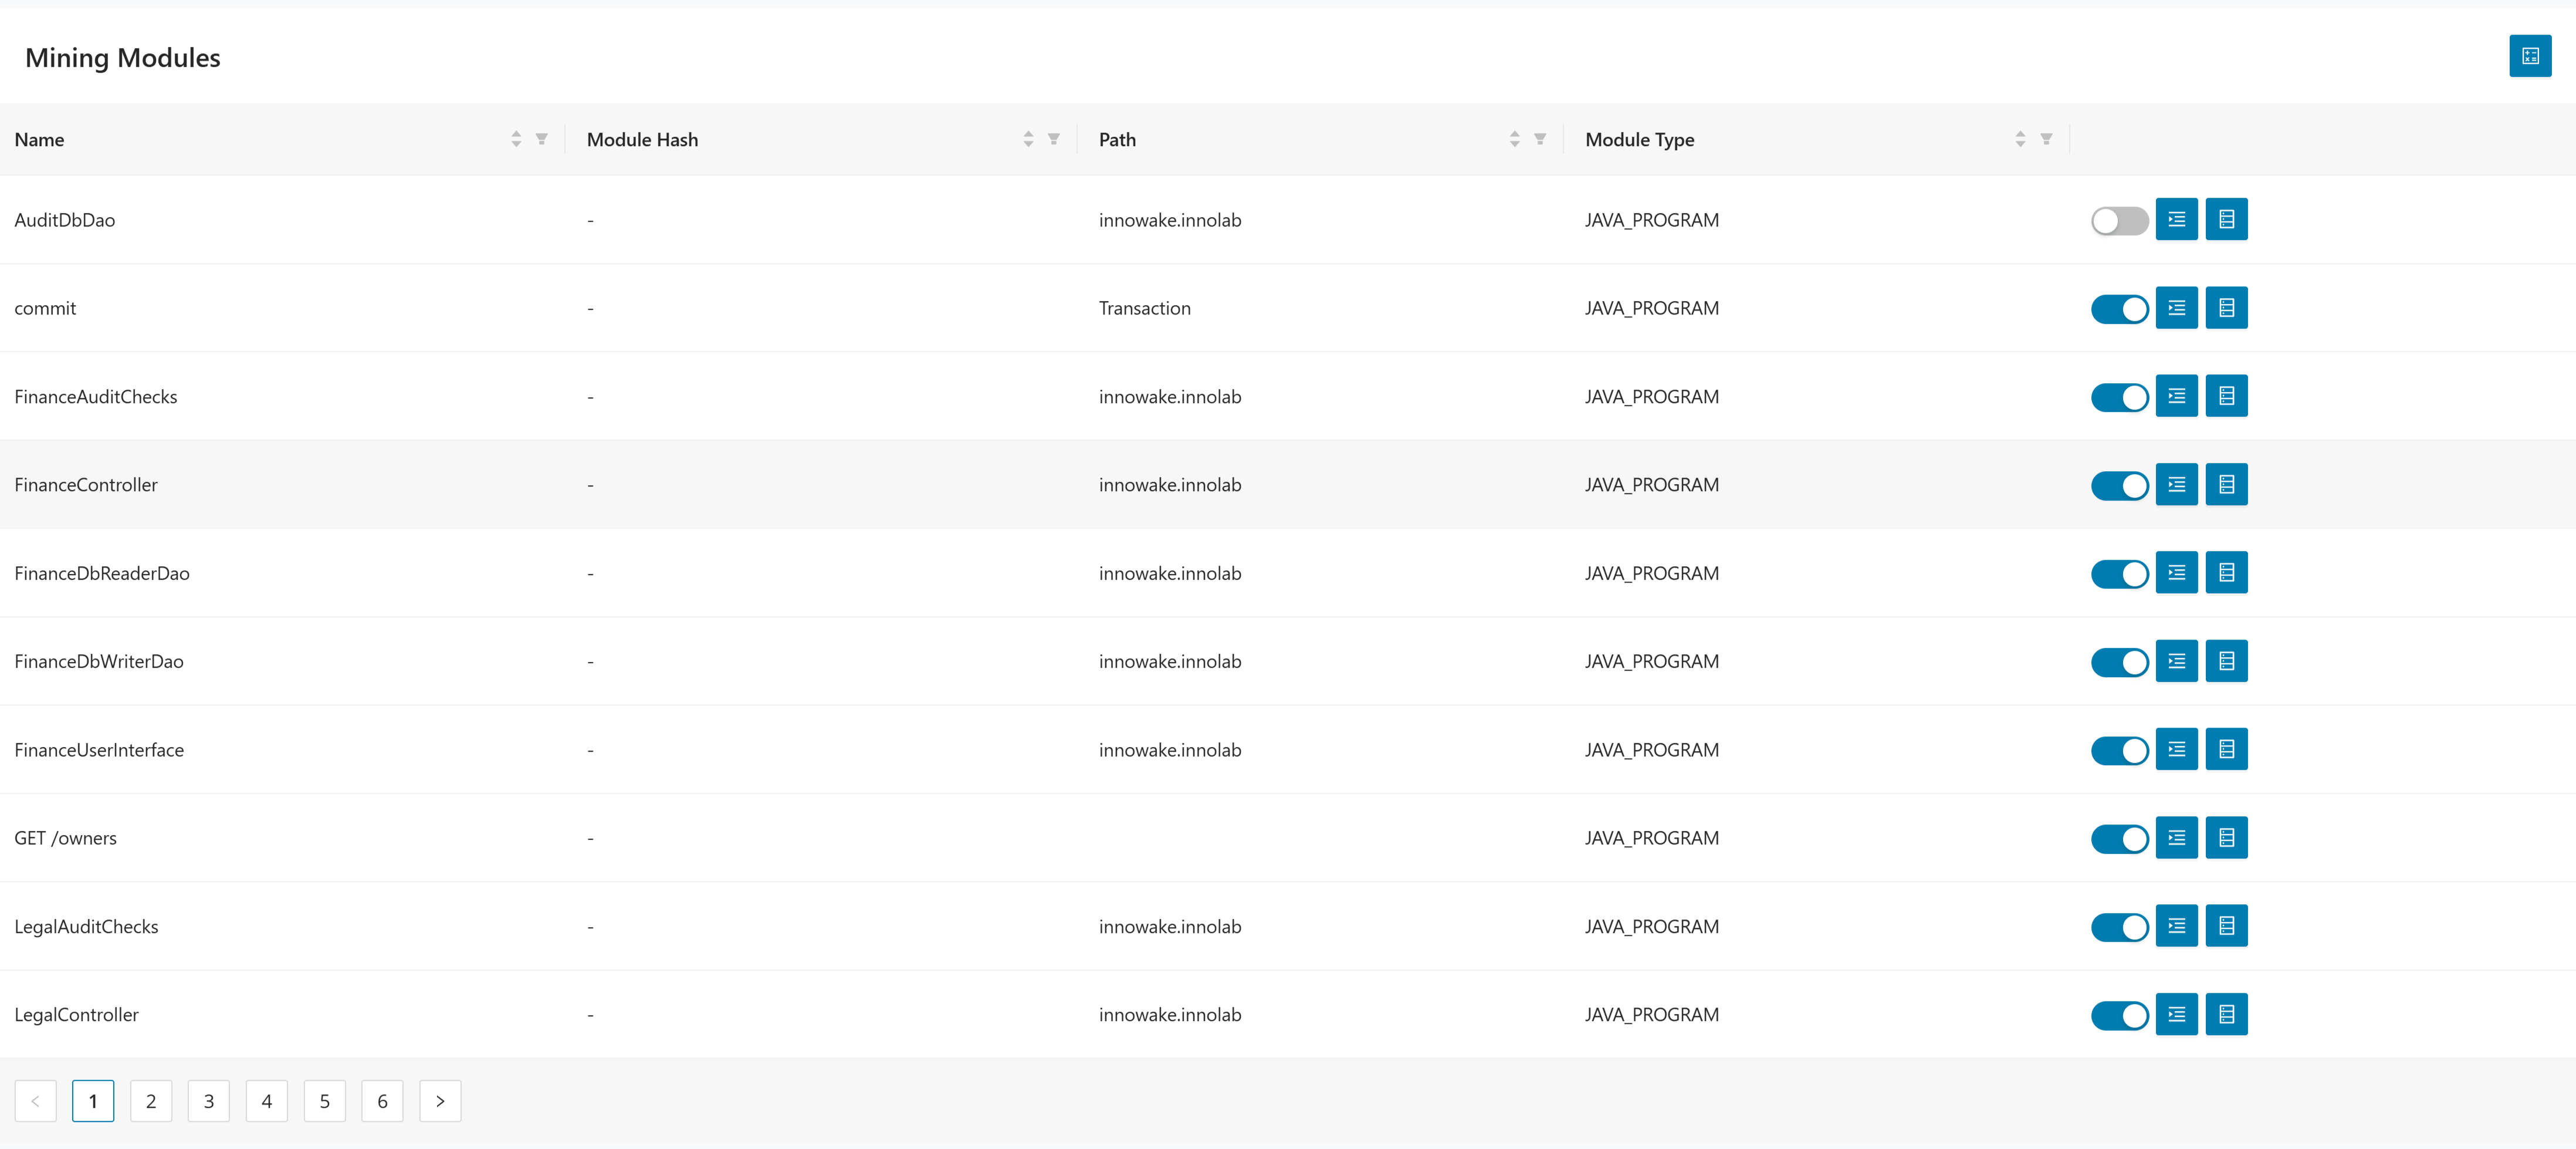
- Use the switch in the module row to control whether the module is included in Tracer results.
- Use toggle on to include the module in results.
- Use
toggle off to exclude the module from results.
- Click Mining Functions to review the functions for the selected module.
- Review the traced functions for that module.
- Use the recorded line range and duration values to inspect the function activity.

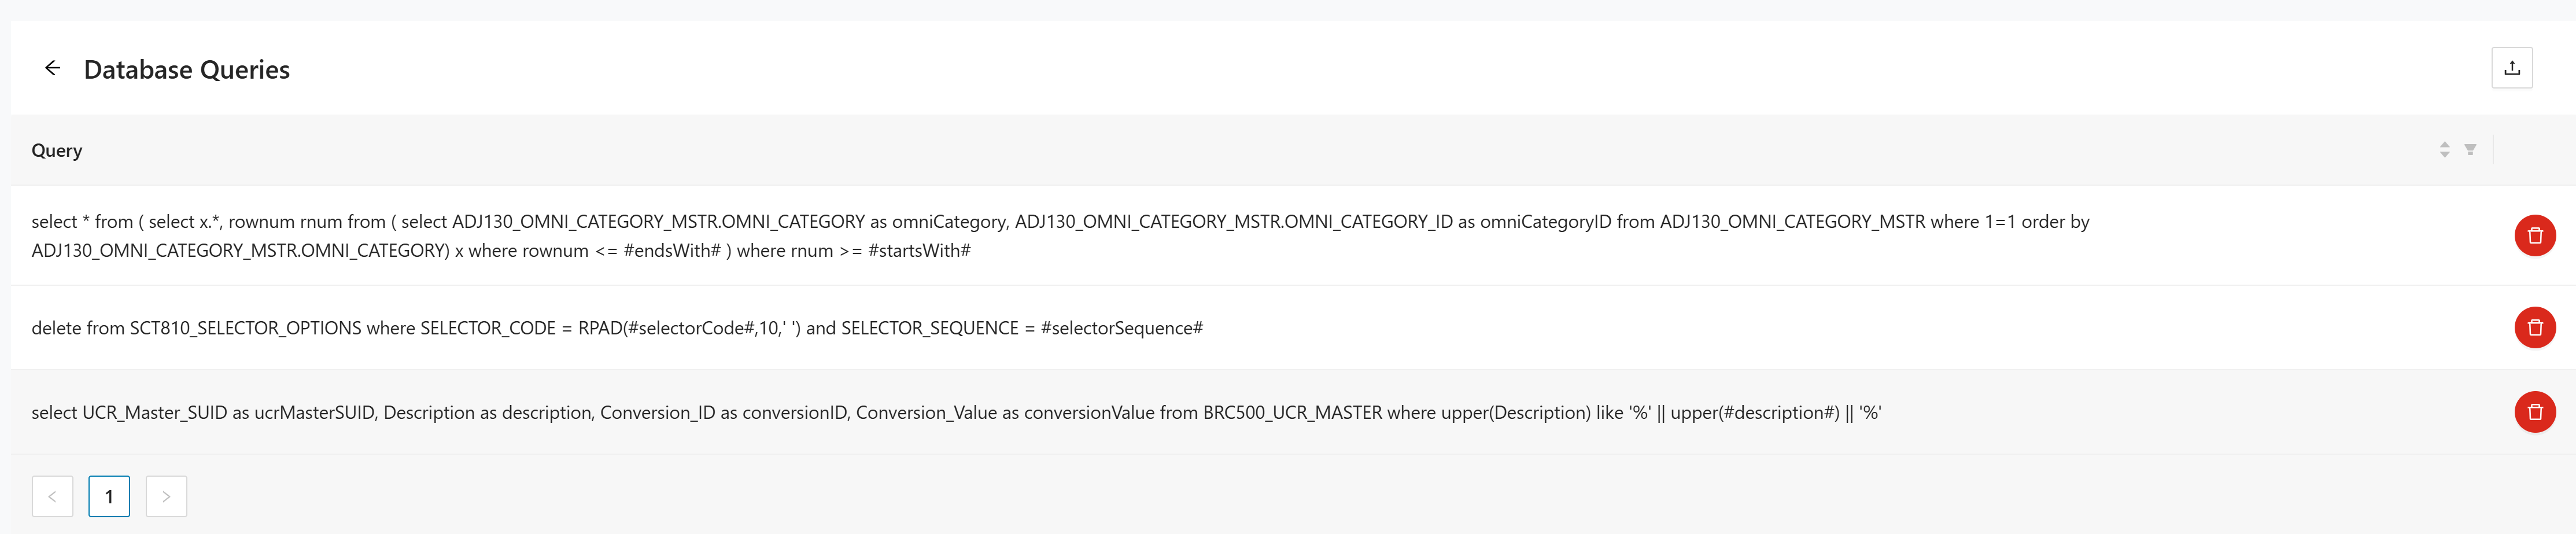
- Click Database Queries to review the database queries for the selected module.
- Review the traced SQL statements associated with that module.
Use the pagination controls at the bottom of the table to move through the full module list.
Upload logfile
Use Upload Logfile to import trace data into the project. This is the step where runtime evidence enters Tracer and becomes available for processing and probability calculations. Use the correct upload panel for each log type so the collector can interpret the data properly.
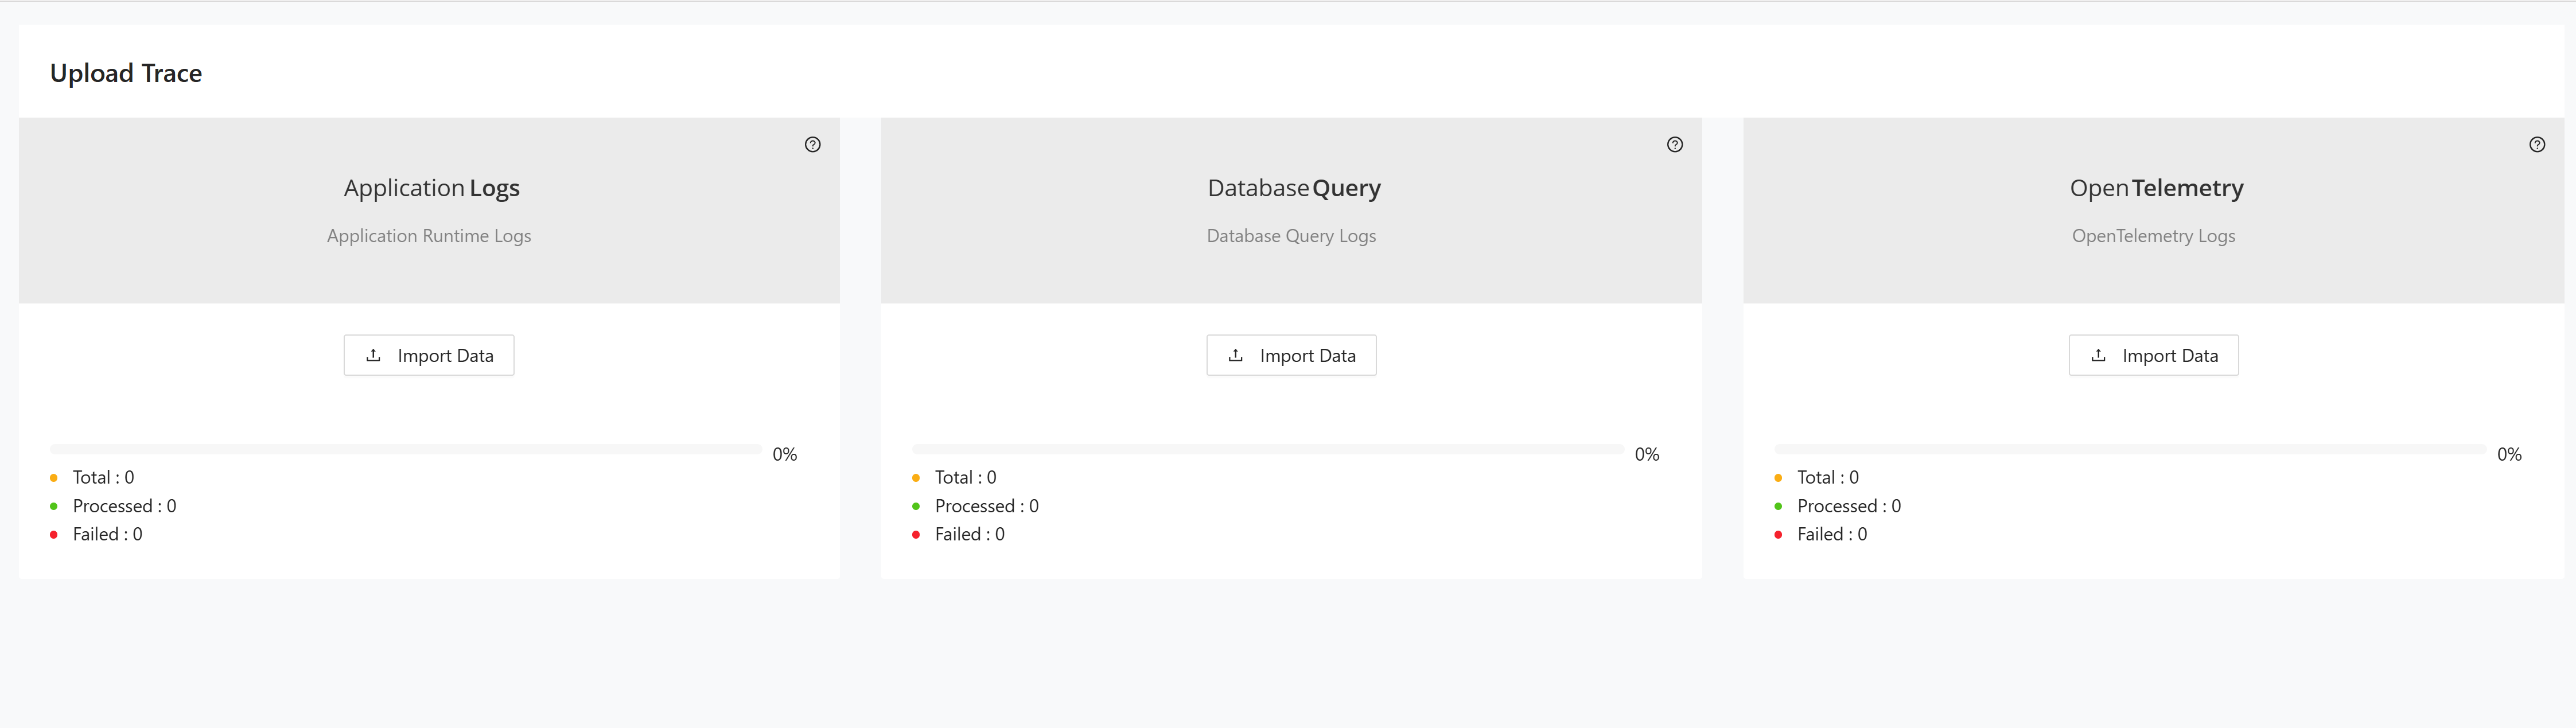
The page contains three upload panels:
- Application Runtime Logs for application runtime traces.
- Database Query Logs for database access traces.
- OpenTelemetry Logs for trace data produced by OpenTelemetry instrumentation.
Uploading logs
Use the appropriate panel to load each log type into Tracer.
- In Application Runtime Logs, click Import Data.
- Select the runtime log file to upload.
- Monitor the progress bar and the counters for Total, Processed, and Failed.
- In Database Query Logs, click Import Data.
- Select the database query log file to upload.
- Monitor the progress bar and the counters for Total, Processed, and Failed.
- In OpenTelemetry Logs, click Import Data.
- Select the OpenTelemetry log file to upload.
- Monitor the progress bar and the counters for Total, Processed, and Failed.
Repeat these steps for each log type you want to load.
Reports
The Reports section exposes the analysis outputs generated from the traced users, taxonomies, mappings, and uploaded logs. These views help you turn collected runtime data into decisions about usage, taxonomy alignment, and decomposition candidates. Review them after the upstream setup and log-ingestion steps are complete.
Results dashboard
The Results Dashboard provides download links for the main Tracer output files and summarizes module usage.
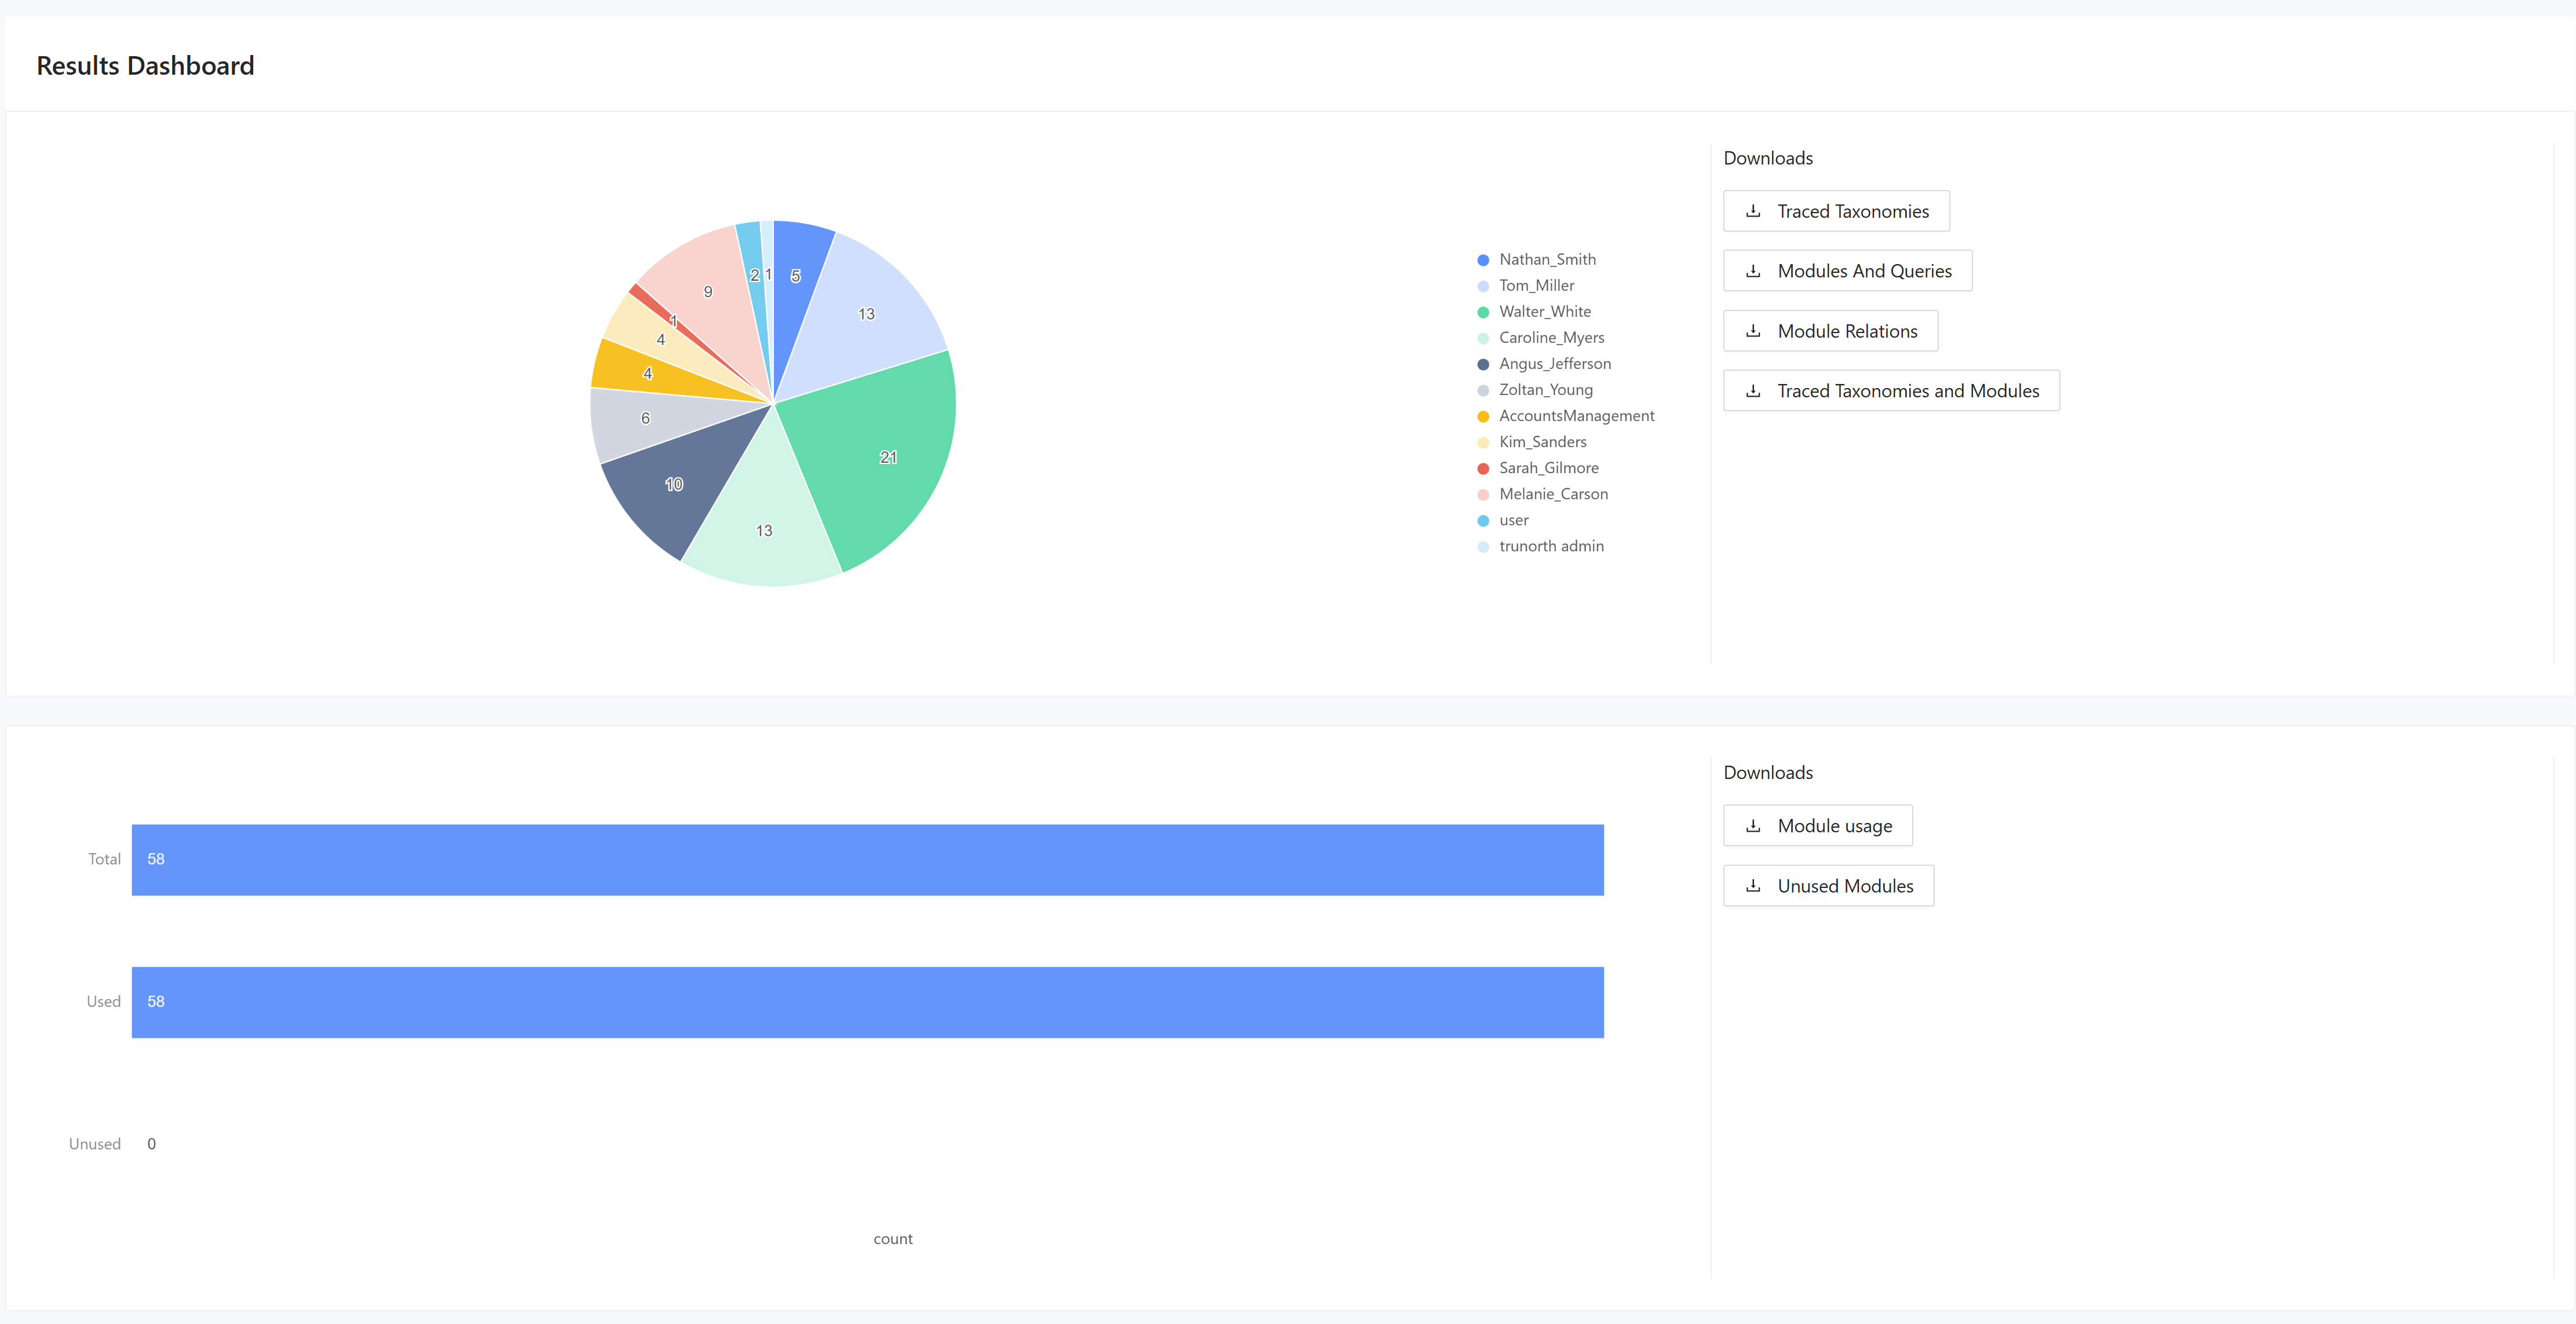
Use the dashboard to download:
- Traced Taxonomies
- Modules And Queries
- Module Relations
- Traced Taxonomies and Modules
- Module usage
- Unused Modules
The chart in the lower section compares the used and unused module counts for the project.
Taxonomy usage
The Taxonomy Usage report calculates the probability that modules belong to a taxonomy based on traced activity.
For the calculation model and worked examples behind these probability values, see Tracer Probability Calculation.
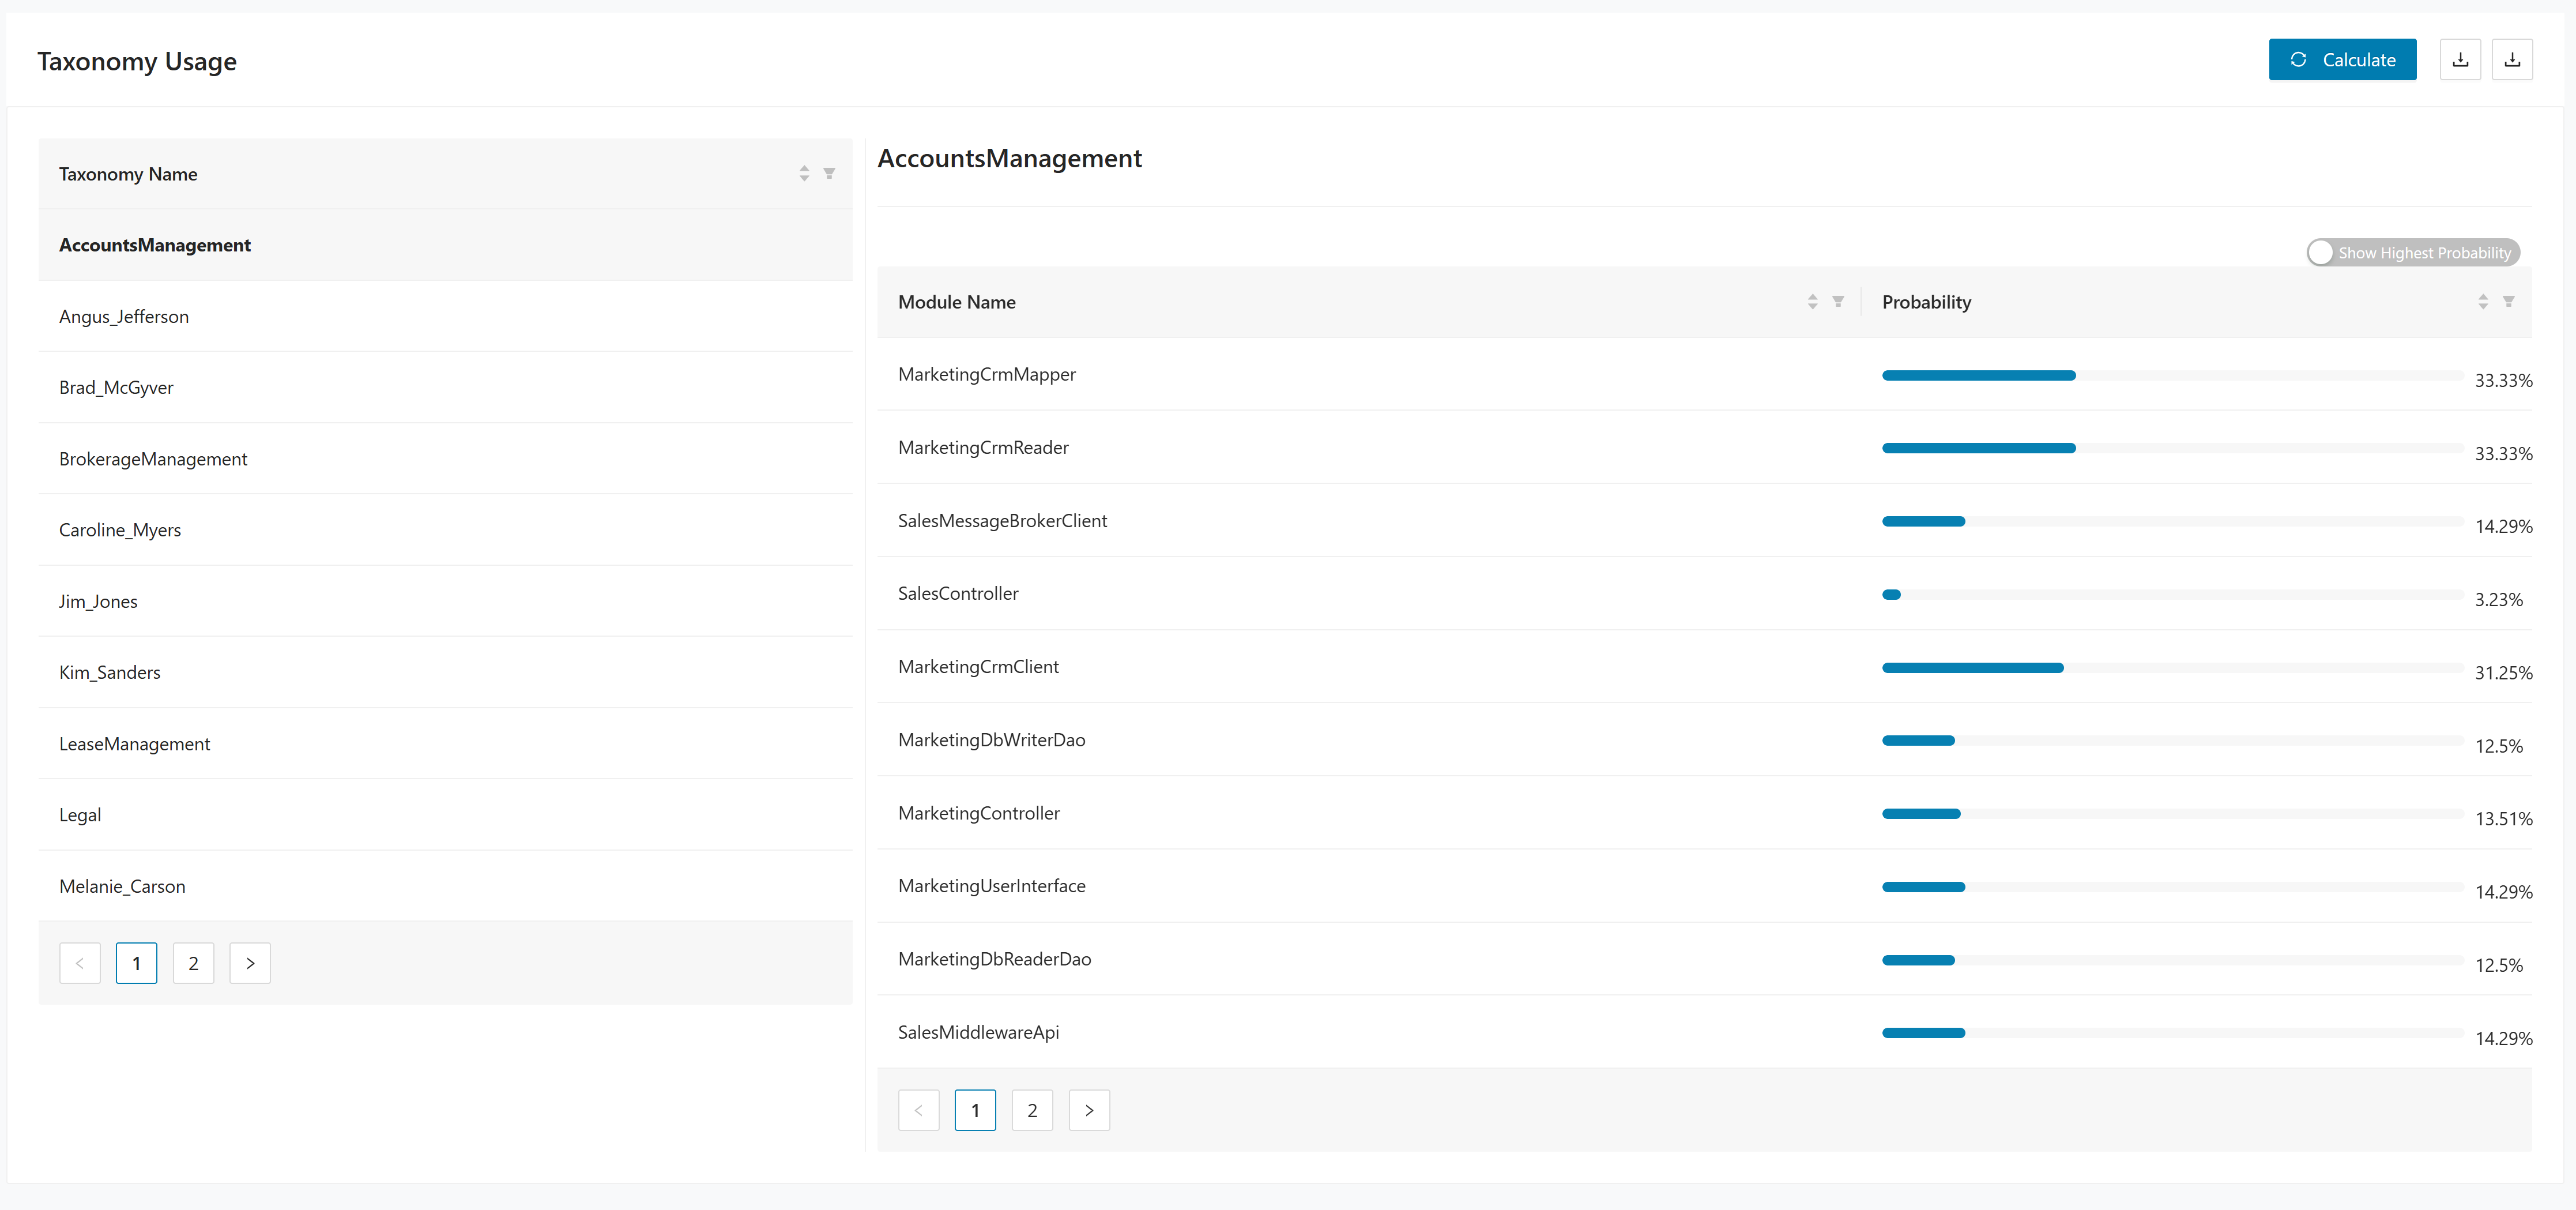
Use this page as follows:
- Click Calculate to run the probability analysis.
- Review the taxonomy list in the first table.
- Use Show Highest Probability to focus on the strongest taxonomy matches for modules.
Module usage
The Module Usage report combines the traced module list with usage counts by taxonomy.
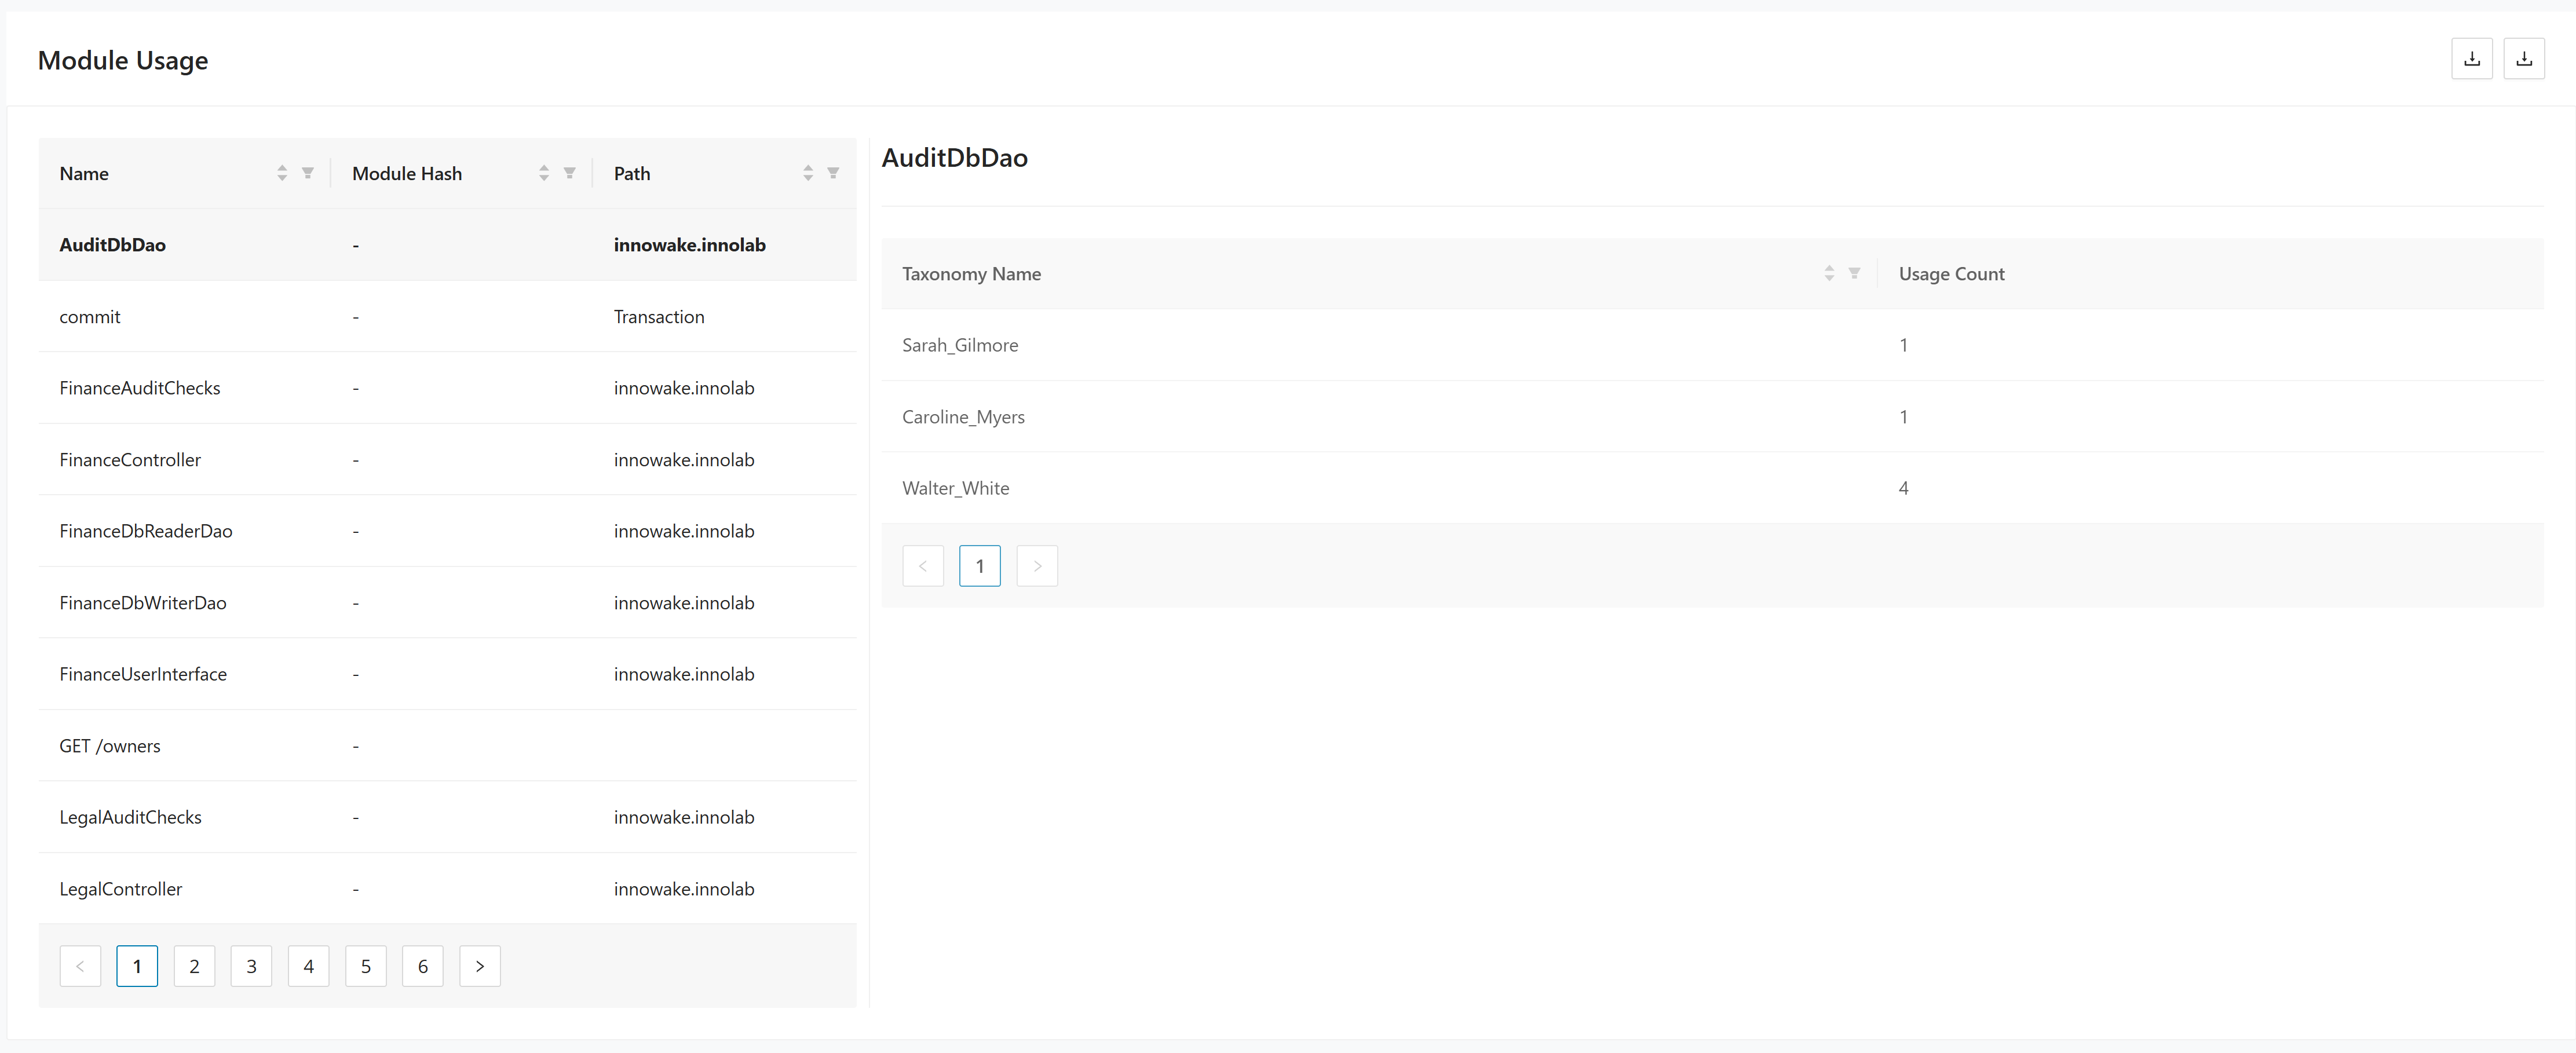
Use this page as follows:
- Review the upper table for the traced module list, including the module name, hash, and path.
- Review the lower table for the usage count per taxonomy when probability results are available.
- Use the pagination controls to move through the module list.
Total function usage
The Total Function Usage report lists functions together with their taxonomy, module, and probability values.
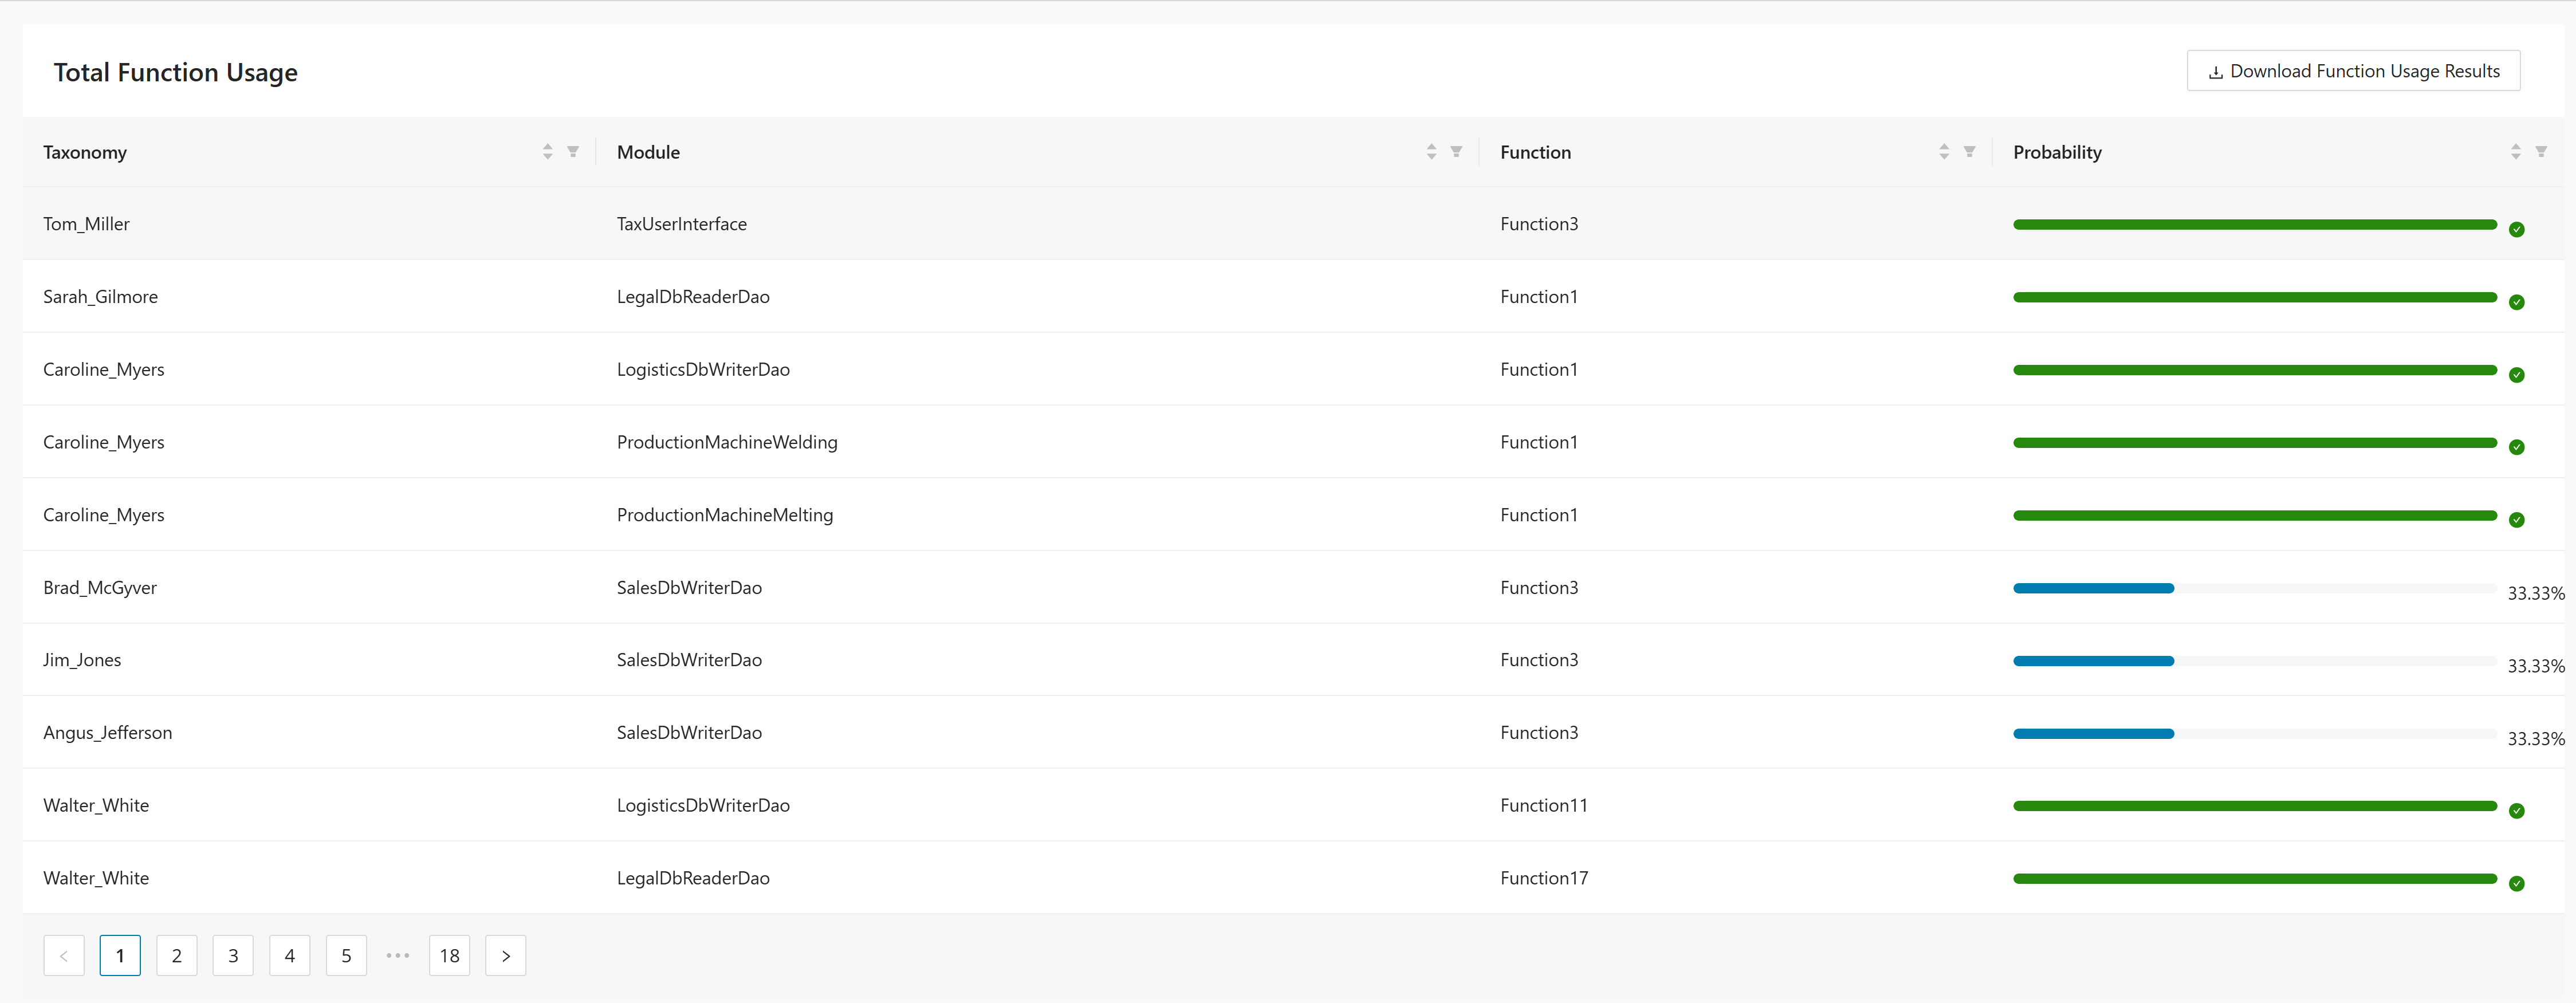
Use this page as follows:
- Review the Taxonomy, Module, Function, and Probability columns.
- Use the pagination controls to move through the result set.
- Click Download Function Usage Results to export the current report.
Social graph
The Social Graph report visualizes relationships around a selected taxonomy and supports graph export.
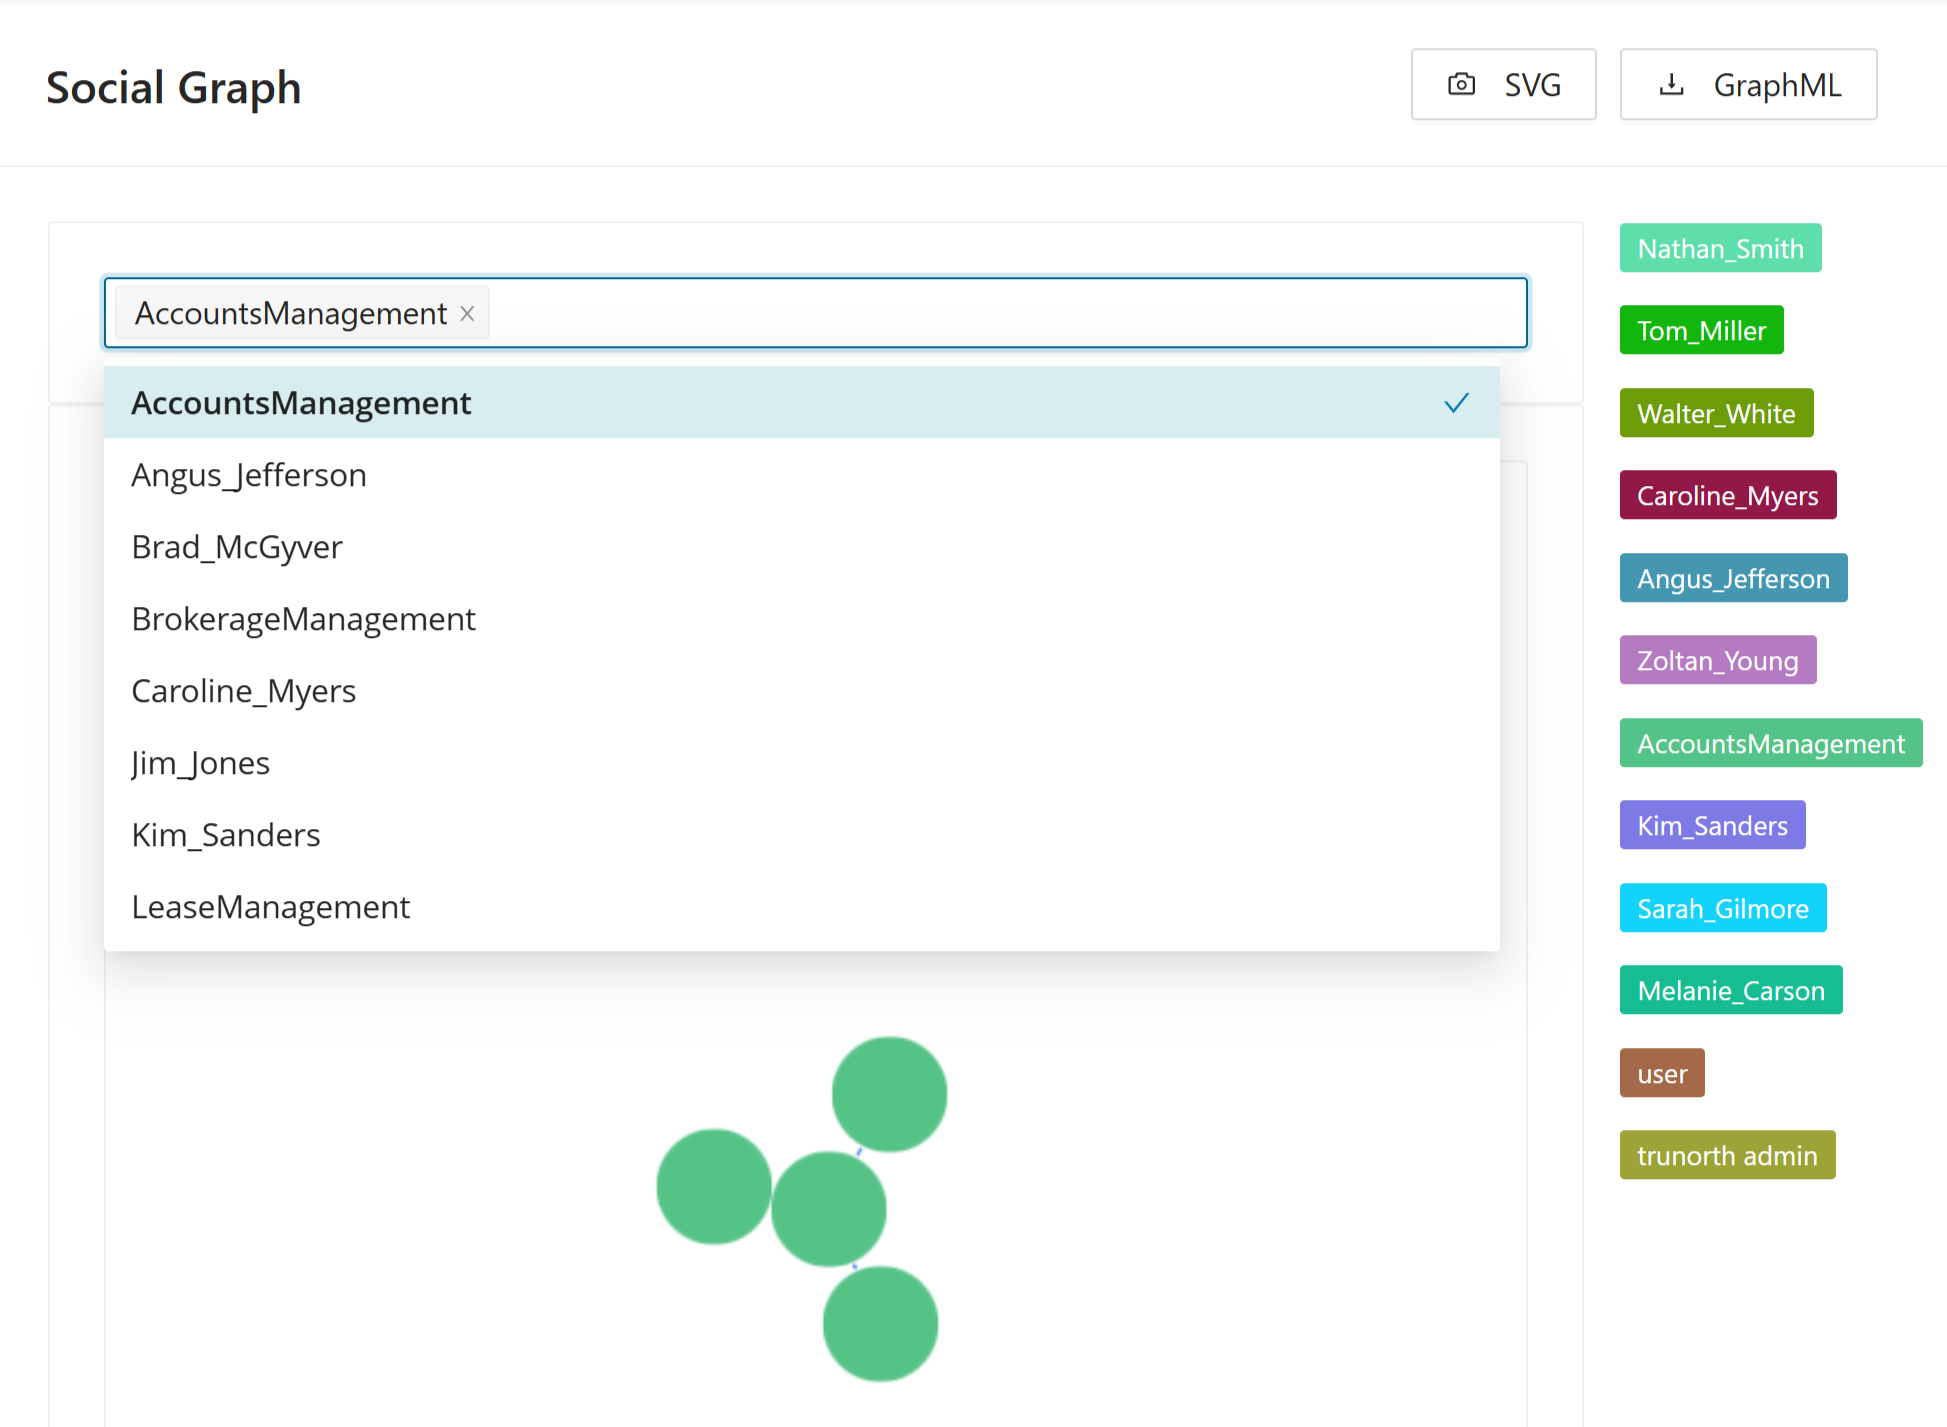
Use this page as follows:
- Select a taxonomy from Select specific taxonomy.
- Review the generated graph for the selected taxonomy.
- Click SVG or GraphML to export the current graph.
If the project does not yet contain taxonomy data, the page cannot generate the graph.
Taxonomy graph
The Taxonomy Graph report visualizes the selected taxonomy and supports SVG export.
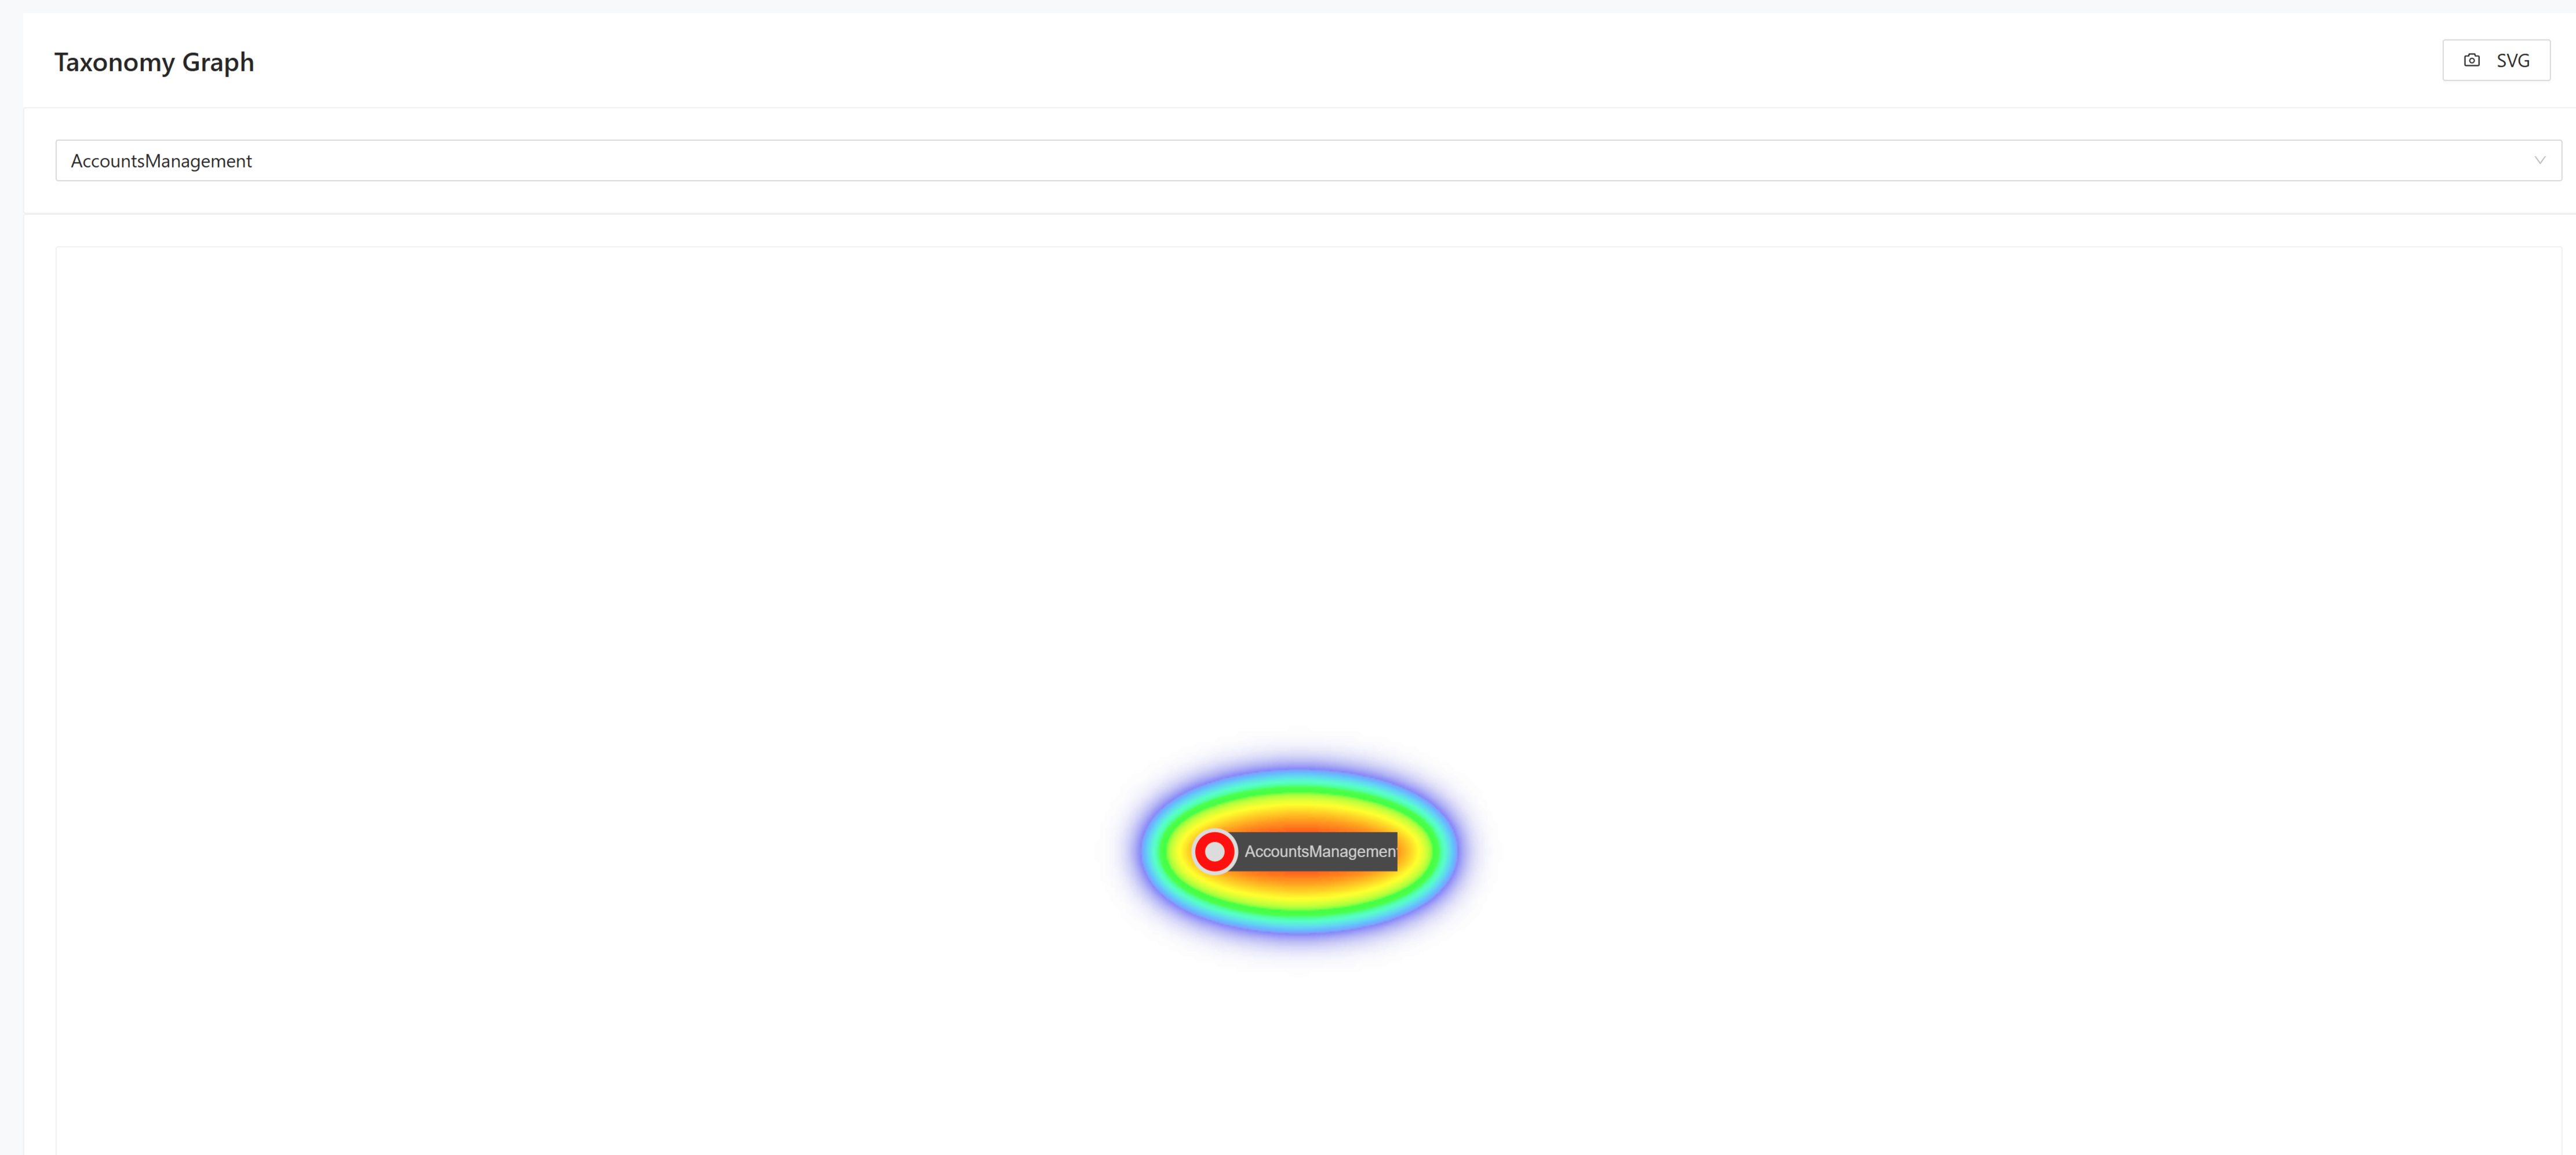
Use this page as follows:
- Select a taxonomy from the drop-down list.
- Review the generated business process graph for the selected taxonomy.
- Click SVG to export the graph.