Taxonomy Graph
Taxonomy Graph visualizes taxonomies created in the Mining UI or edited in Taxonomy Editor by using Union, Intersect, Tag from Endpoint, and related options. It also shows the taxonomies created after Reachability analysis. Use this page to analyze taxonomies visually, compare their relationships, and continue editing them as needed.
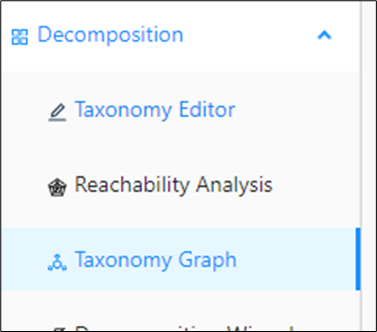
In the left navigation panel, navigate to Decomposition > Taxonomy Graph.
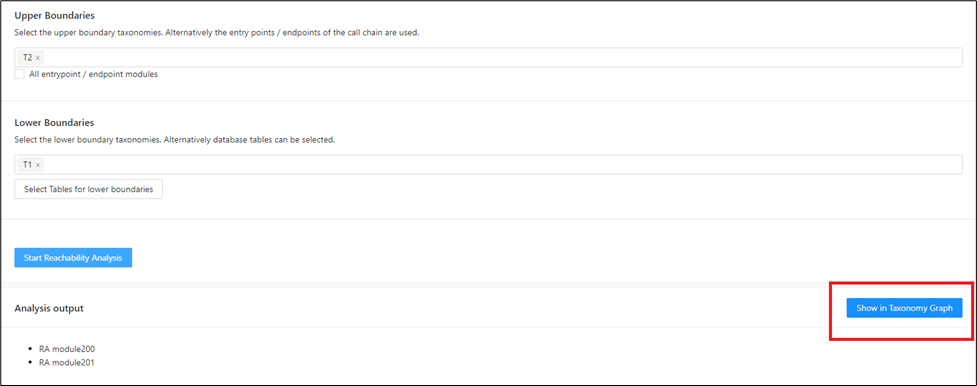
You can also open it directly after Reachability Analysis.
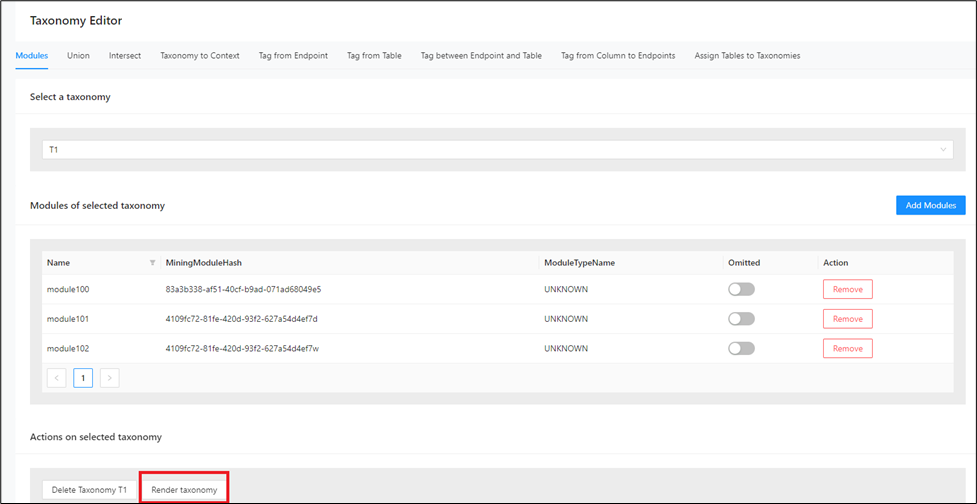
You can also open it from the Modules tab in Taxonomy Editor.
Right-click a taxonomy and select Taxonomies > Show edges to other to display edges to other taxonomies. By default, those edges are hidden.
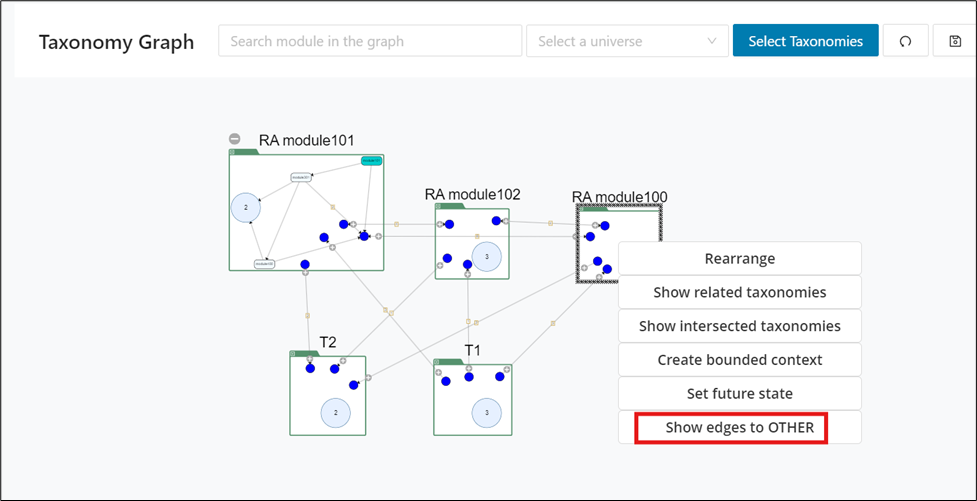
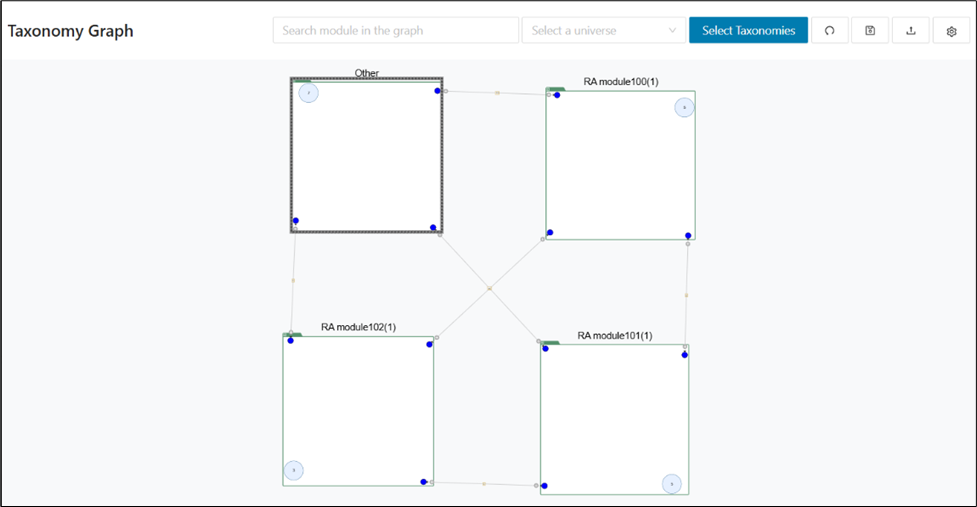
The taxonomies without any edges to Others will display a warning message.
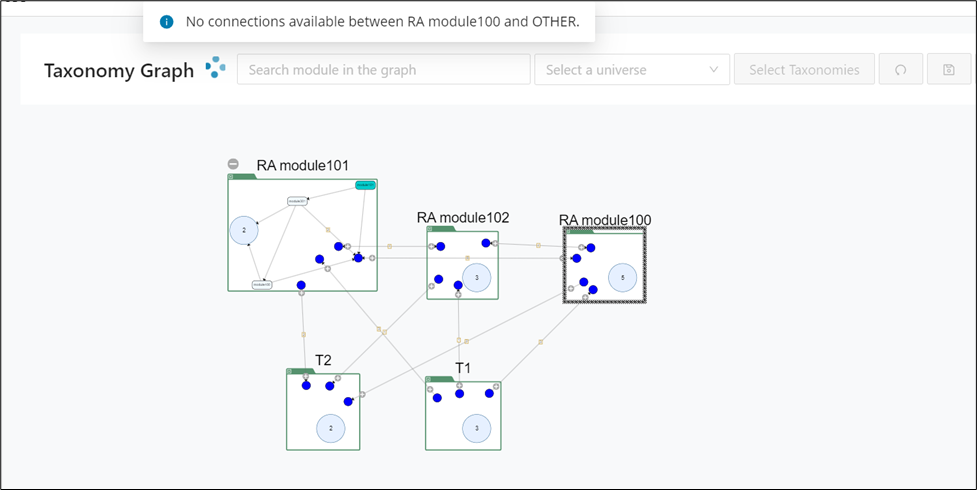
The sections below describe the main Taxonomy Graph features.
Main features
The main feature set is designed to help you control what appears in the graph and how much detail is visible at a given time. These controls are essential when you move from a simple overview to a more focused inspection of taxonomy relationships. Review them first so you can navigate larger taxonomy sets efficiently.
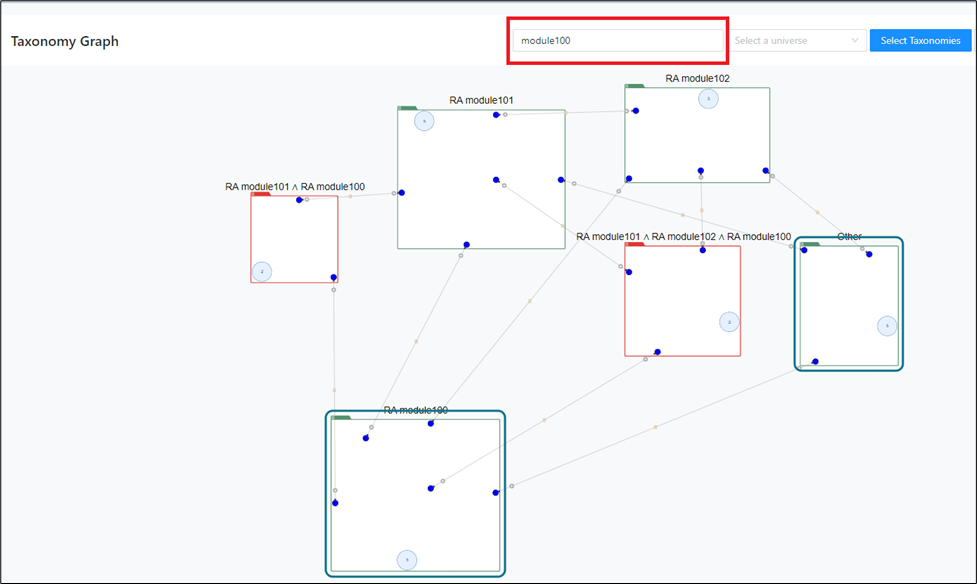
Search taxonomies by module
This will highlight the taxonomies in which the searched module is present by a dark border.
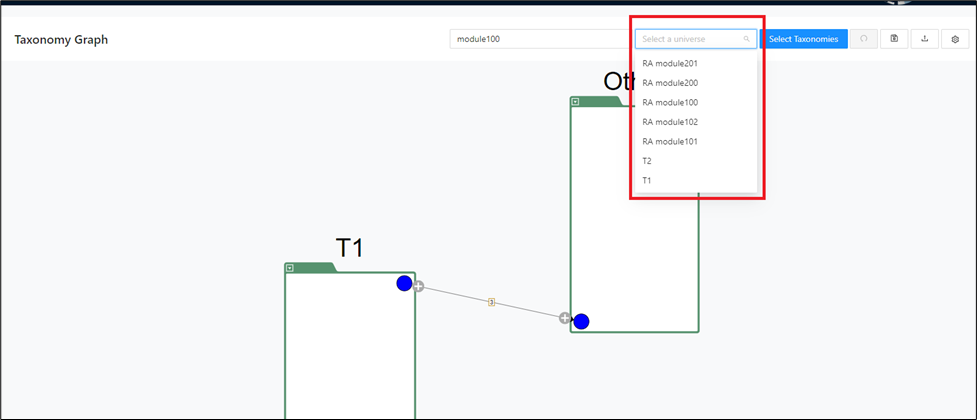
Select a universe
This will compare the taxonomy displayed on the screen to the universe selected. If no universe is selected, the entire set of taxonomies for the project are taken into consideration.
Select taxonomies to display
This will display only the taxonomies that are selected and hide the remaining unselected taxonomies from the graph.
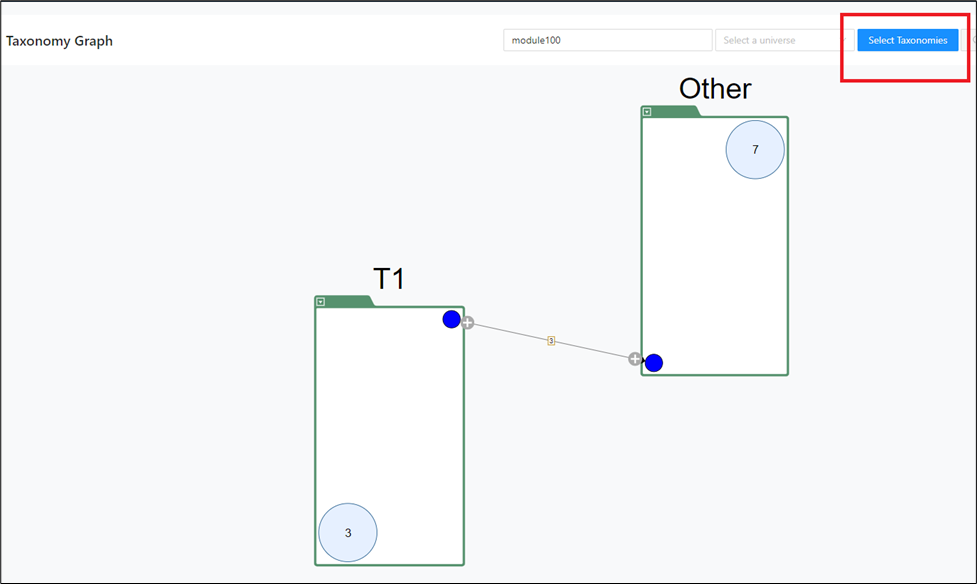
The taxonomies can be selected one by one by clicking on the check boxes alongside them or selected all at once using the checkbox beside Name.
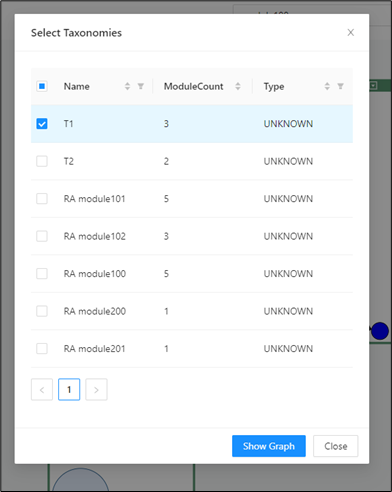
Filters and sorters can be applied here based on the Name, Module Count and Type of the taxonomies to narrow down the results in case of large number of taxonomies.
Save graph configuration
Use this option to save the current graph state with the module counts. This is useful if you later edit taxonomies and want to reload the saved state.
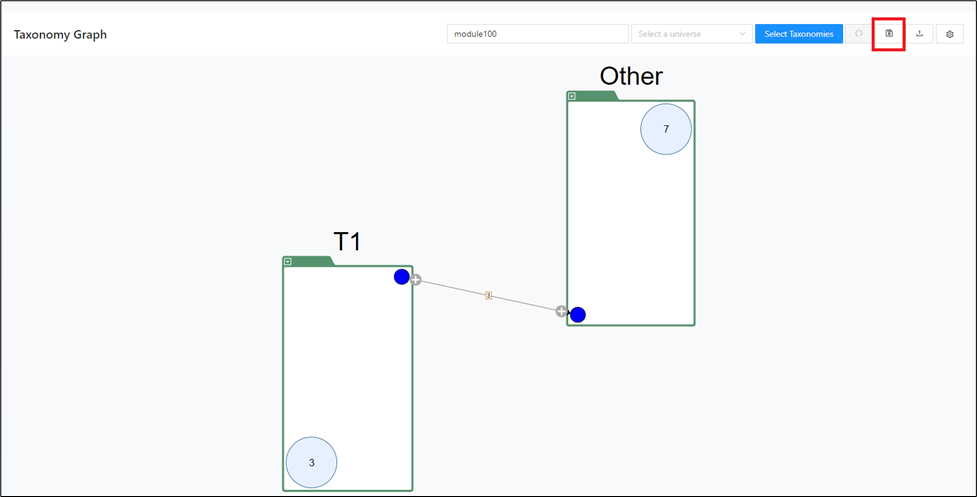
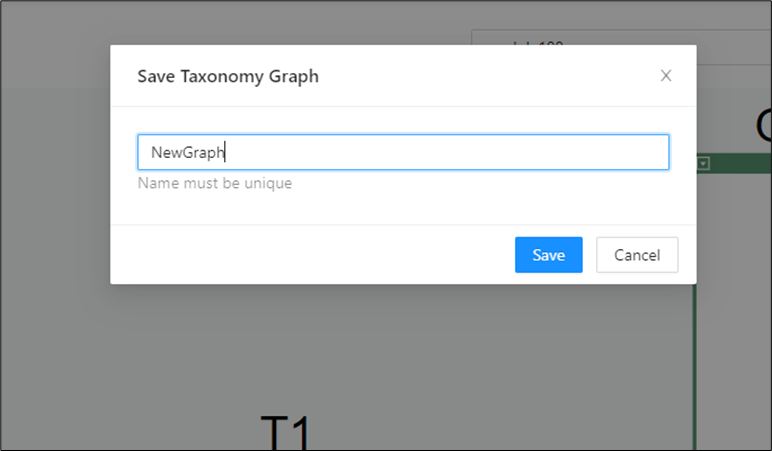
A name needs to be provided and saved.
Load a saved graph
Use this option to load a graph that you saved earlier. It restores the taxonomy state, especially the modules present in each taxonomy, if later changes need to be rolled back.
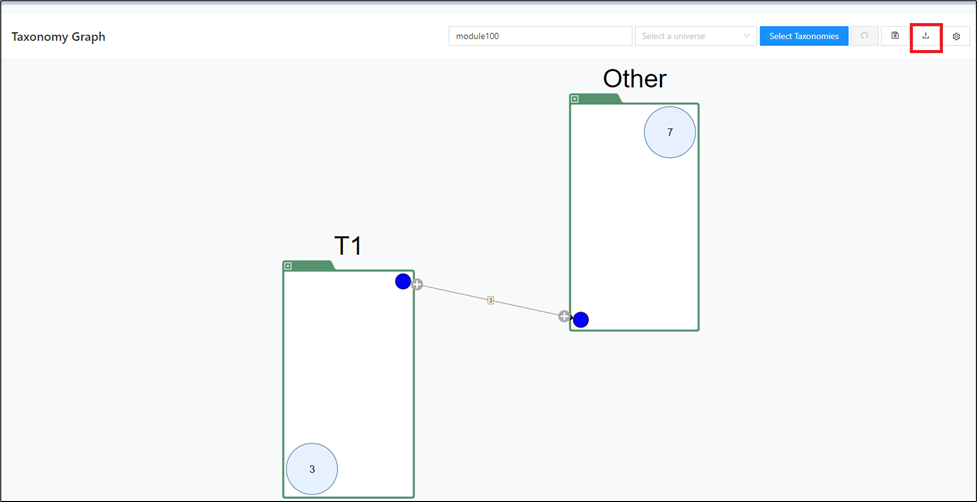
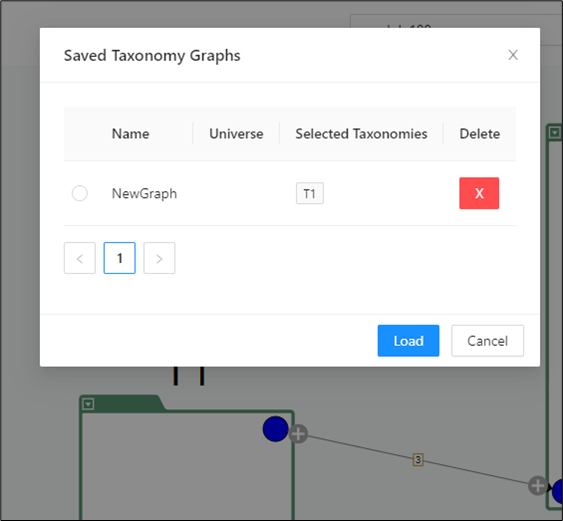
The configuration needs to be selected and loaded.
Graph options
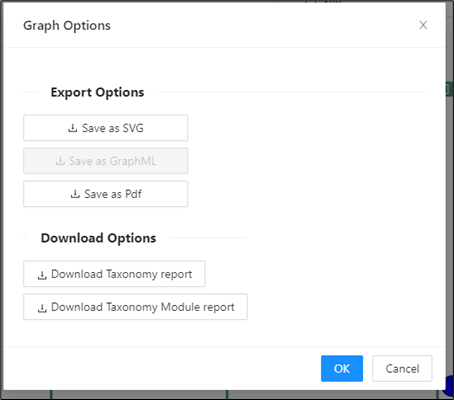
Use this menu to export the graph as SVG, GraphML, or PDF, or to download the taxonomy report and taxonomy module report.
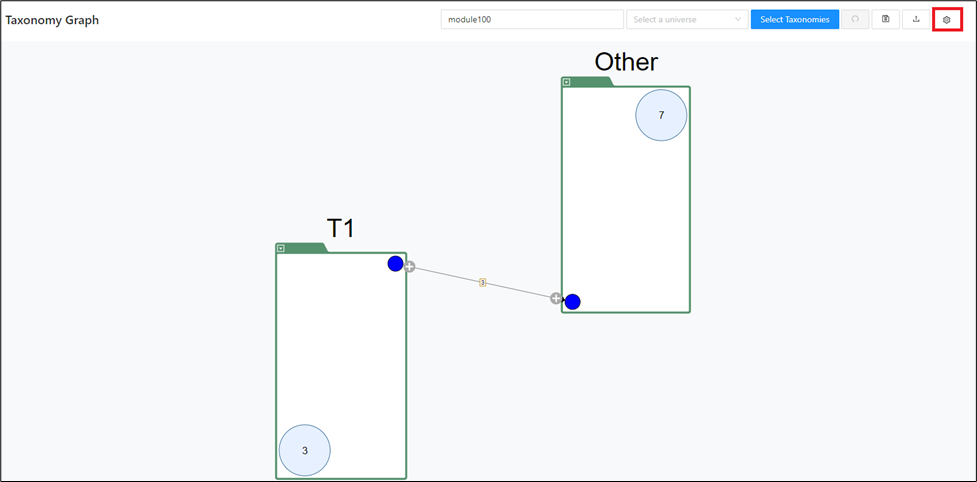
Clicking on the options below does the action mentioned earlier.
Undo
The undo icon is used to revert any move operations (moving modules to and from taxonomies).
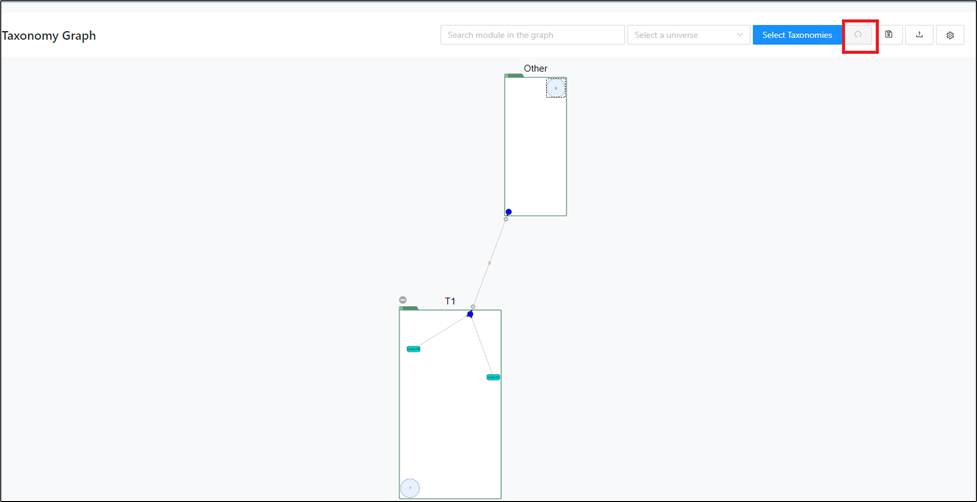
Explanation of the graph elements
The graph uses several visual elements to show taxonomy structure, shared resources, and module-level relationships. Understanding these elements makes the later editing actions easier to interpret and less error-prone. Use this section as a quick legend before you expand nodes or move modules.
The graph shows:
Taxonomy names
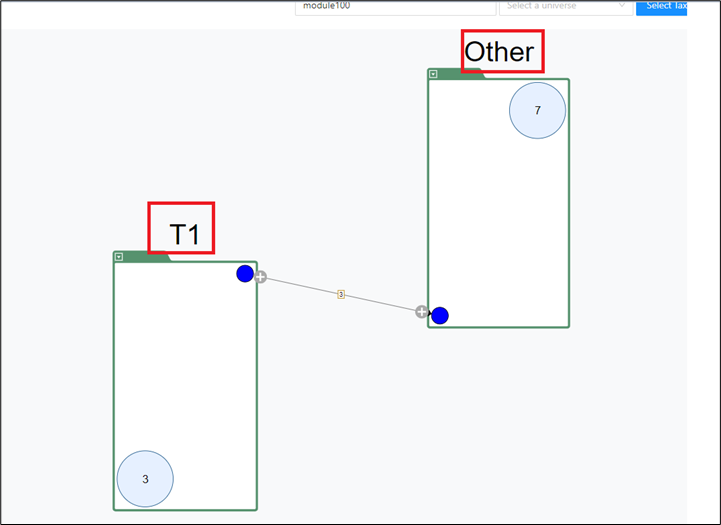
Boundary modules
Boundary modules are modules that create an external connection to another taxonomy.
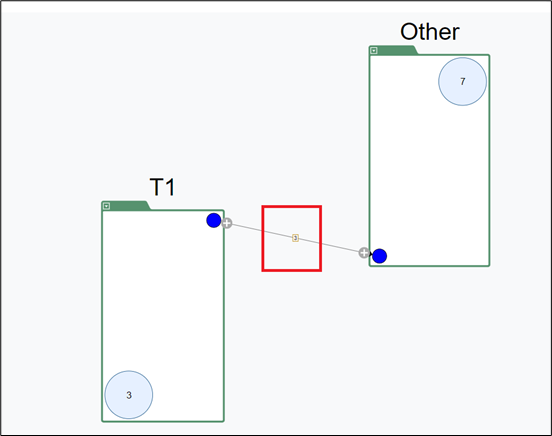
Drawer window
The number on the edge connecting the two taxonomies shows the number of external connections between the two taxonomies.
Clicking an edge opens a drawer that shows the boundary modules or all modules in the connected taxonomies. You can move modules from one taxonomy to the other from this drawer.
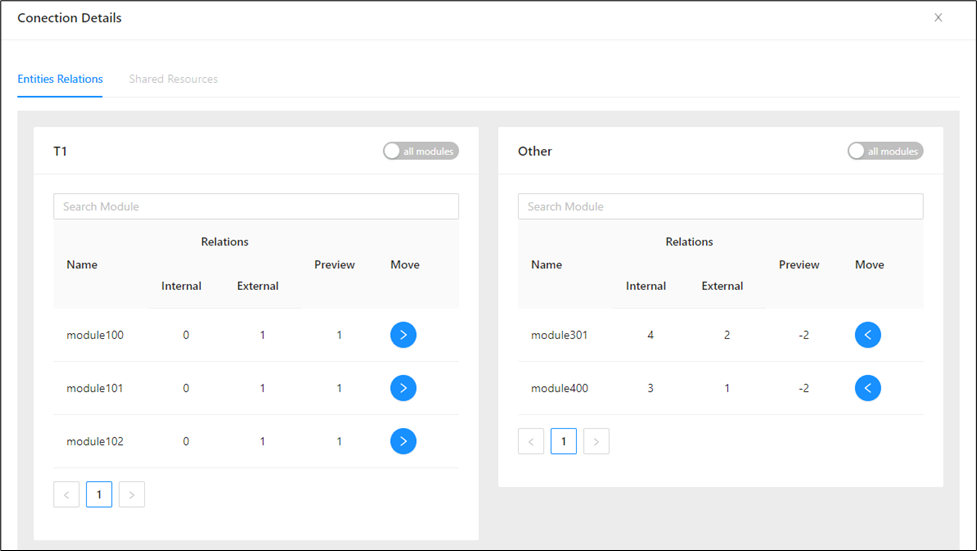
This drawer shows the names of the boundary modules for both the taxonomies along with number of internal, external connections and preview. This is the number of connections affected if the module is moved to the other taxonomy.
Use the search bar to find a module.
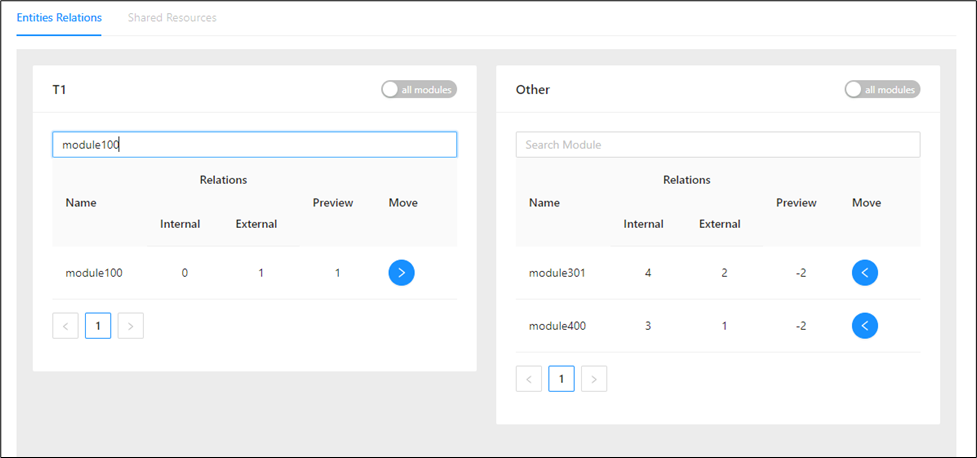
Modules can be moved from one side to the other (left side taxonomy to the right-side taxonomy or vice versa) by either or .
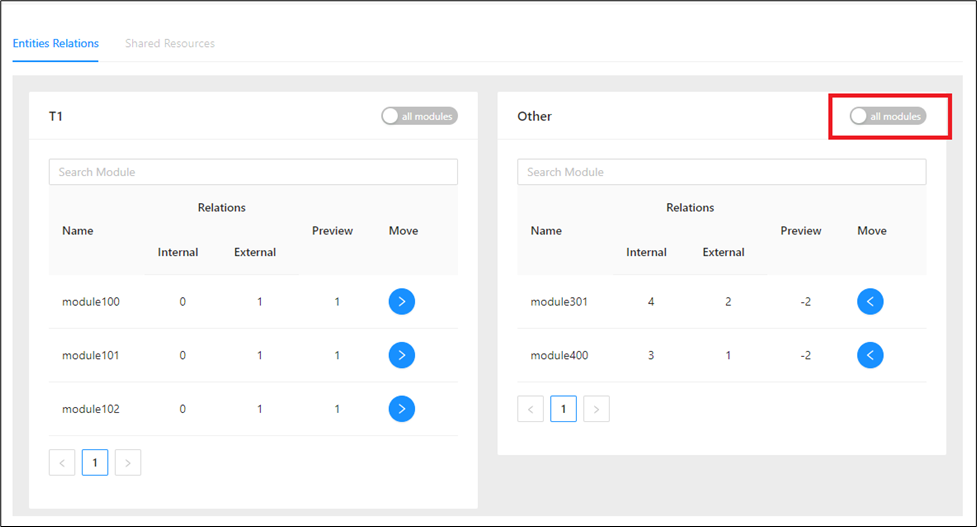
To see all modules, click on the all modules toggle:
To see only boundary modules, click on the boundary modules toggle:
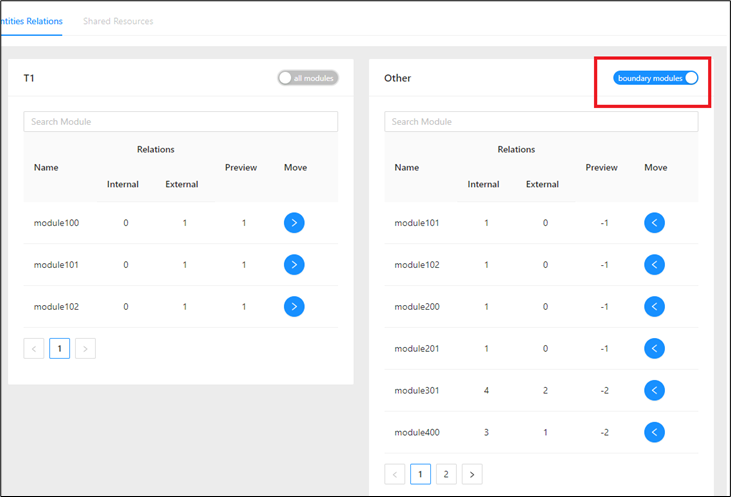
If the all modules switch is not possible to be clicked it means boundary modules = all modules.
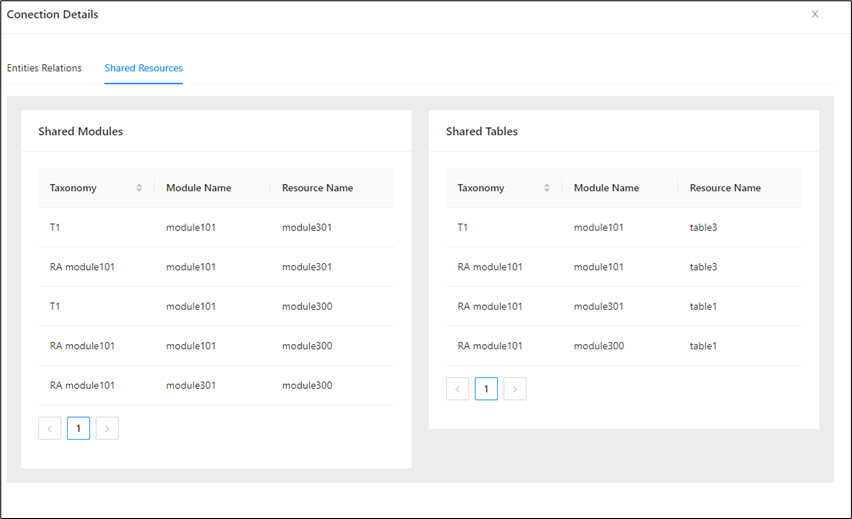
Shared resource
This contains tables/files that are used by modules from at least two taxonomies on the graph. Both taxonomies have an edge to the resource intersection.
Unexpanded modules
The unexpanded modules are shown in the module circles inside the taxonomy.
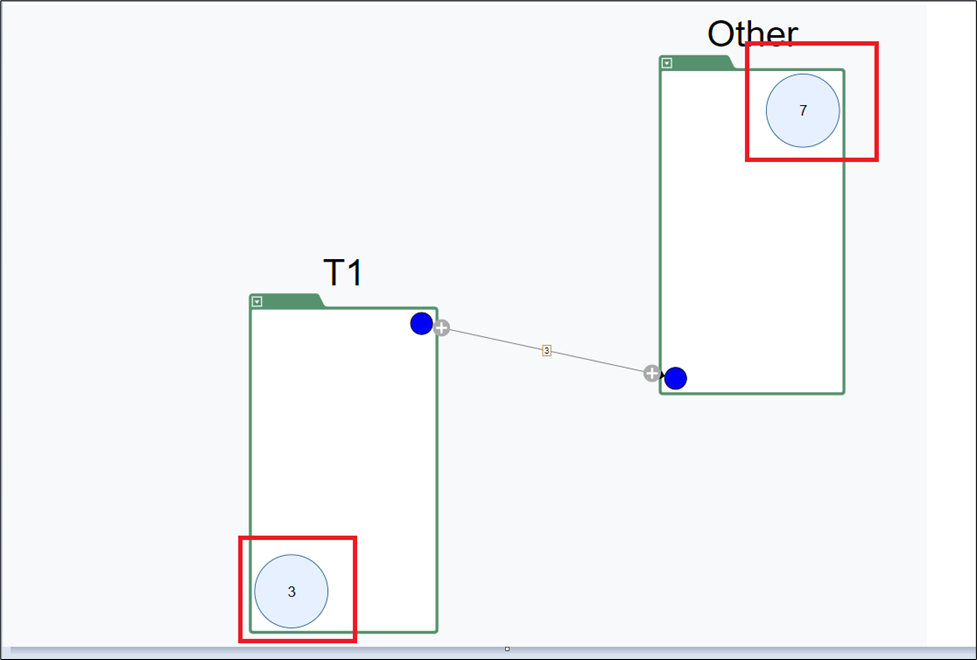
Expand taxonomies
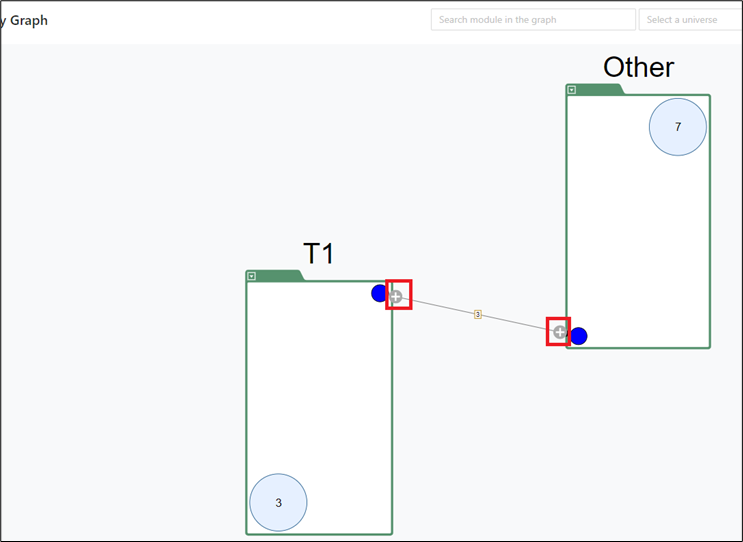
Taxonomies can be expanded to see the relations between the modules inside the taxonomies (internal connections) and to other taxonomies (external connections)
You can do this at once by clicking the expand icon on the edge.
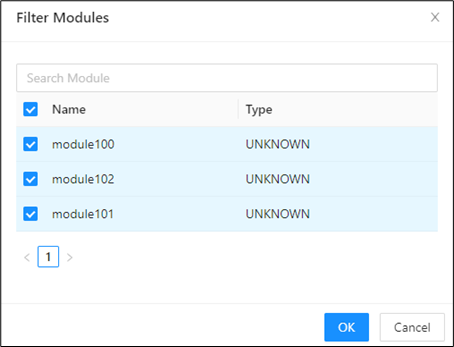
And then selecting all the modules from the window and clicking OK .
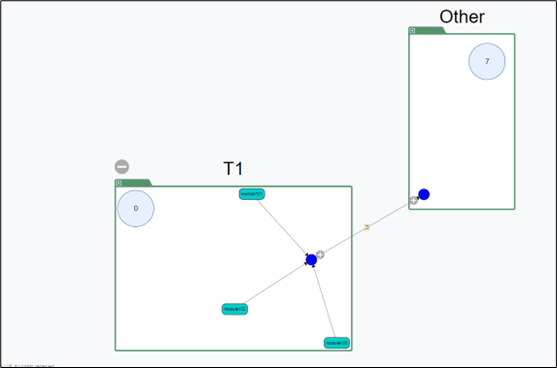
Since all the modules inside the taxonomy are expanded the module count in the circle becomes 0
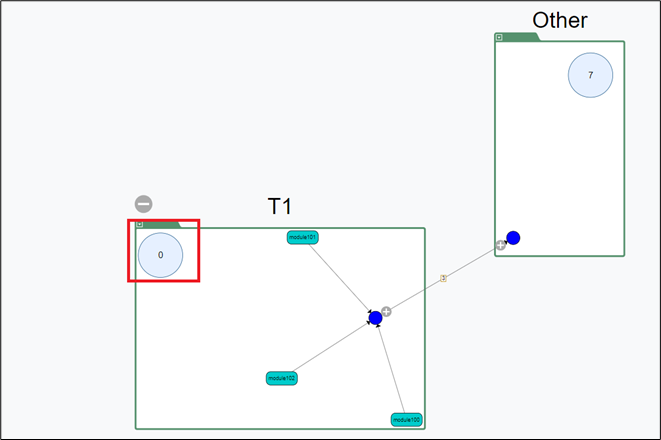
The above graph shows that there is no internal relation between module100, module101 and module102 but they have external connections to the other modules in the remaining taxonomies in the project. This is indicated by the connecting lines to the blue circle.
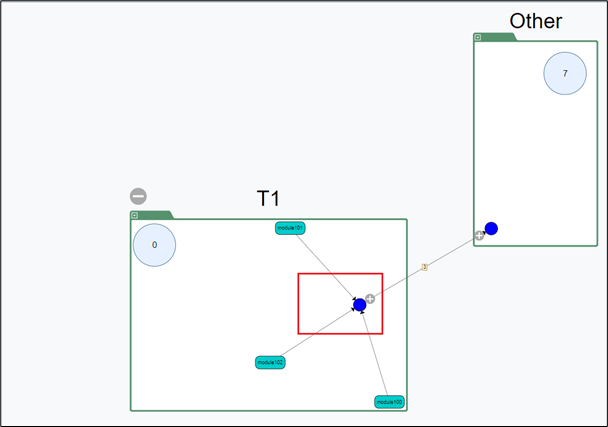
Instead of expanding all internal and external connections at once, you can expand either the incoming or outgoing connection by right-clicking the blue button on the edge of the taxonomy.
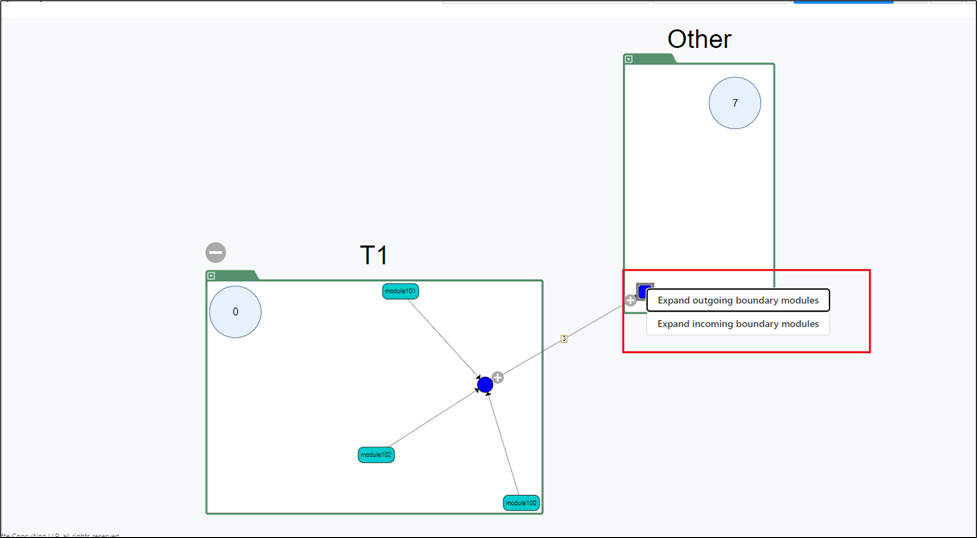
This will selectively expand either the outgoing modules or the incoming modules.
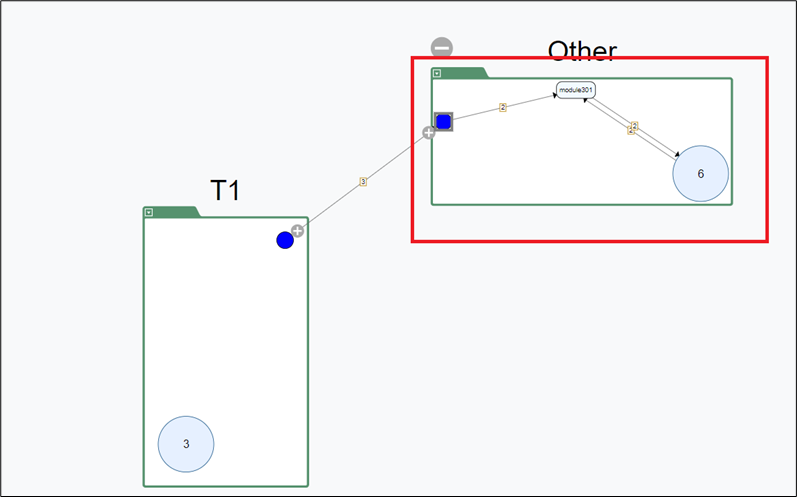
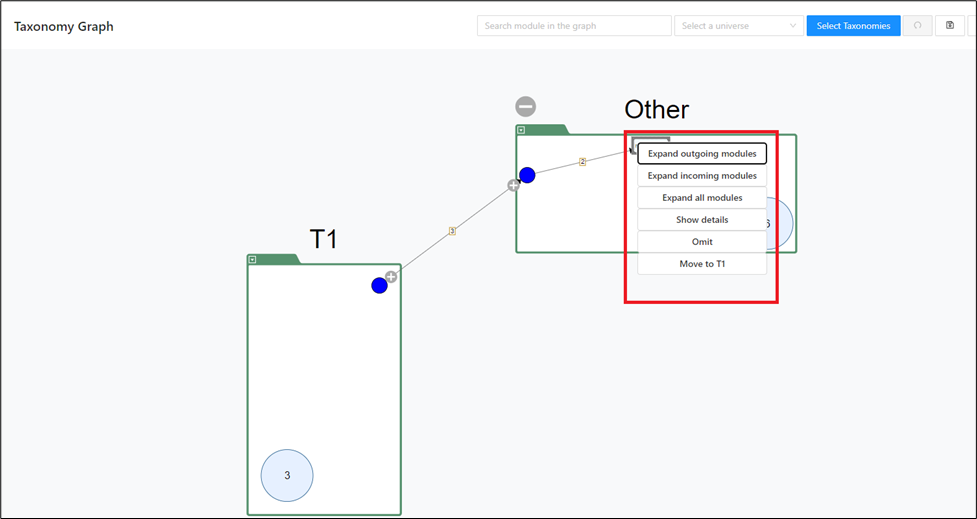
Right-clicking on the expanded module displays some features, for example:
-
Expand outgoing modules: Expands all outgoing modules from the expanded module.
-
Expand incoming modules: Expands all incoming modules into the expanded module.
-
Expand all modules: Expands all modules (incoming + outgoing)
-
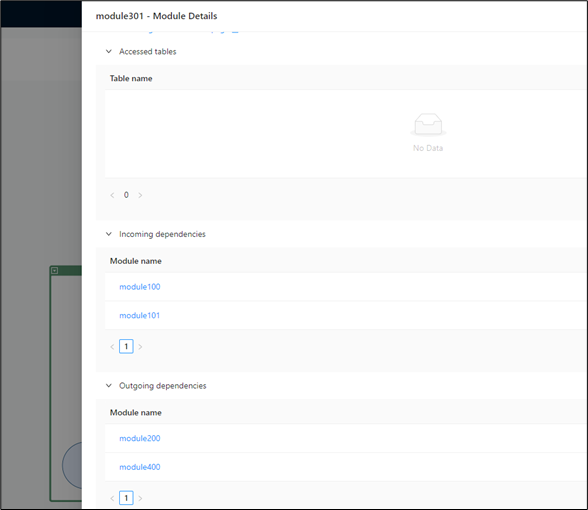
Show Details: Shows the details of the modules with the link to the Mining UI and the outgoing and incoming dependencies.
-
Omit: Temporarily removes the module from the graph along with its module relation to other modules.
-
Move: Moves the module to other taxonomies.
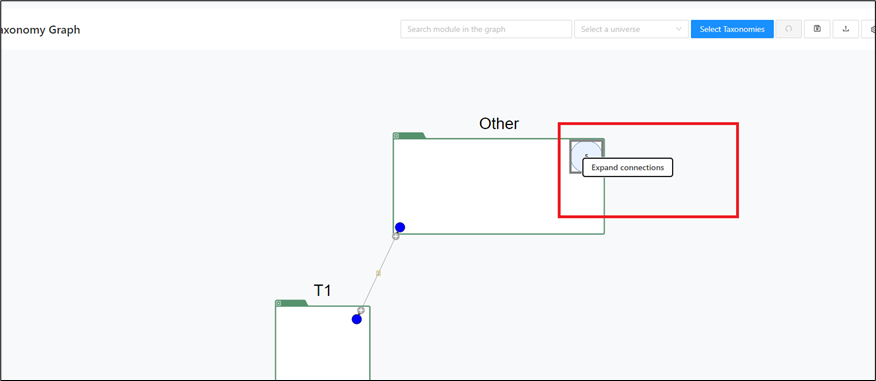
Expand connections
You can also expand taxonomies from the unexpanded module count circles by right-clicking them.
Collapse taxonomies
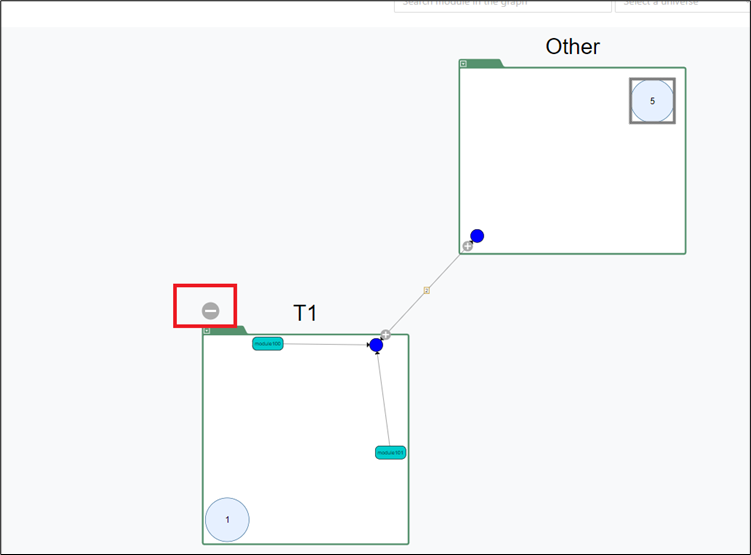
Taxonomies can be collapsed by clicking on the collapse icon of an already expanded taxonomy.
Right-click on taxonomies
Right-clicking on taxonomies opens the options to rearrange the expanded modules or render the taxonomies not displayed currently on the page.
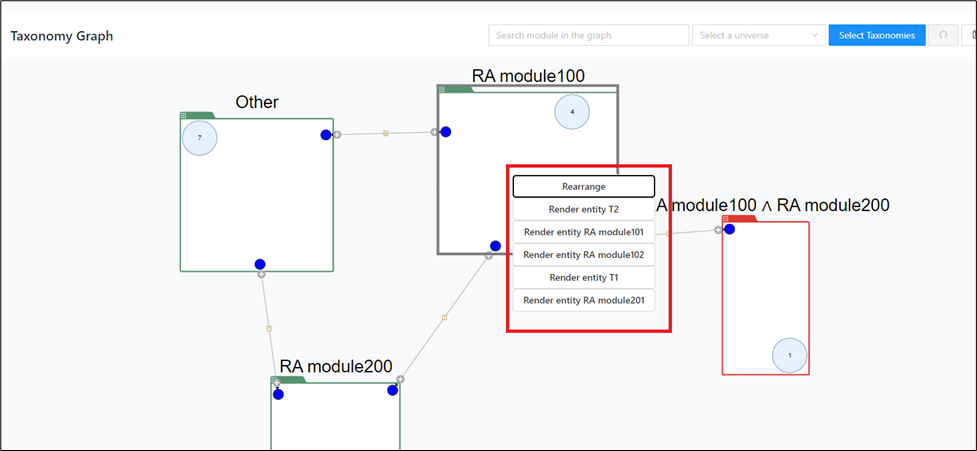
Right-click on empty space
These options help you adjust the graph display.
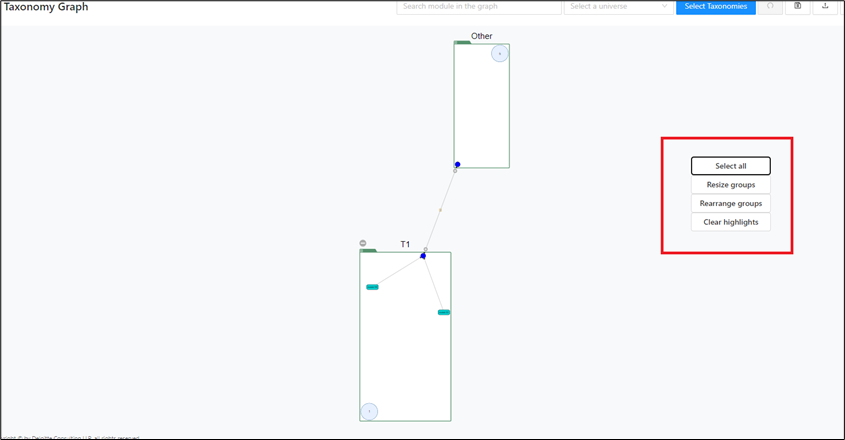
Right-clicking on an empty space displays the following options:
-
Select all: Selects all taxonomies.
-
Resize groups: Is used for resizing.
-
Rearrange groups: Is used for rearranging the taxonomies if the connecting lines/edges overlap.
-
Clear highlights: Clears all existing highlights, for example, after searching for a module in the search bar.
Highlight call chain
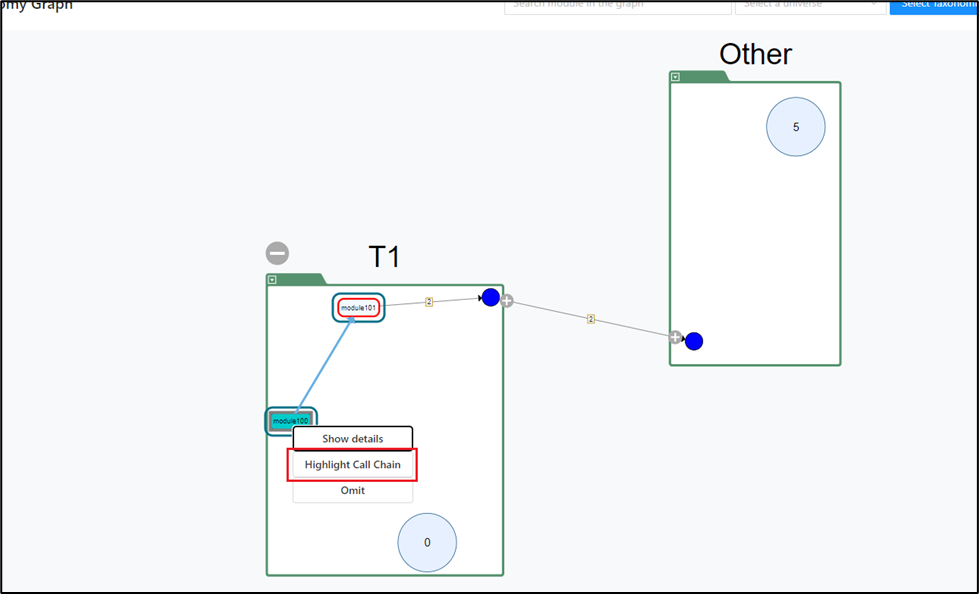
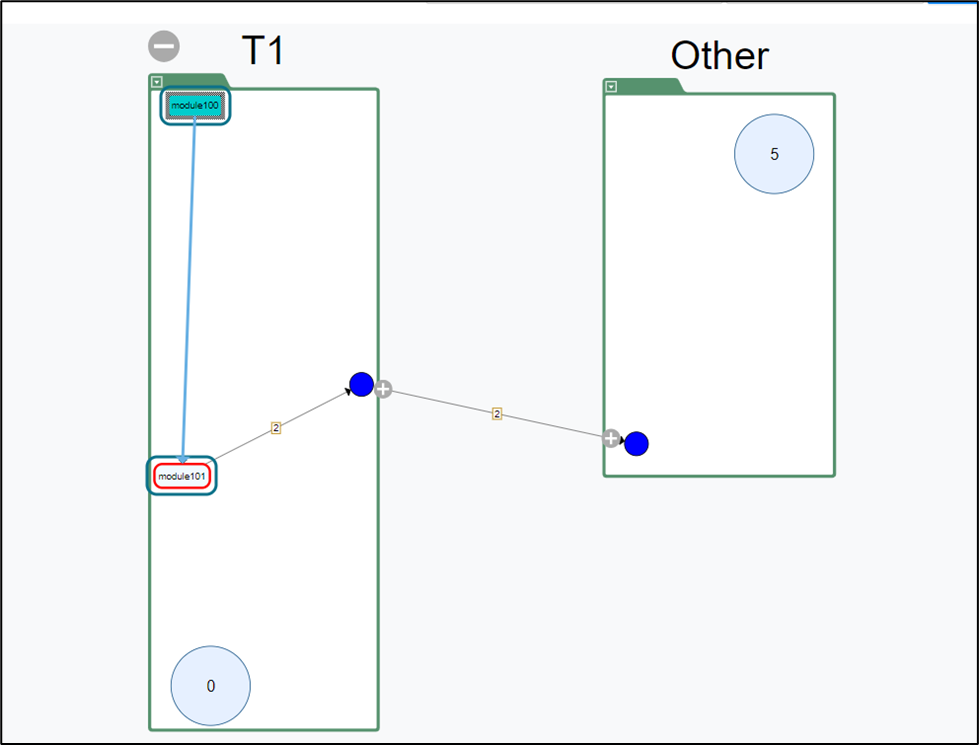
To analyze the dependencies between modules and display the call chain of modules in a taxonomy, right-click on any extended module in the taxonomy and select Highlight Call Chain.
The connection between the selected module and the parent/child module(s) is highlighted.
Set future state
To support taxonomy planning, use Set future state to mark a taxonomy with a specific state so you can return later and continue editing.
To do this, proceed as follows:
Step 1:
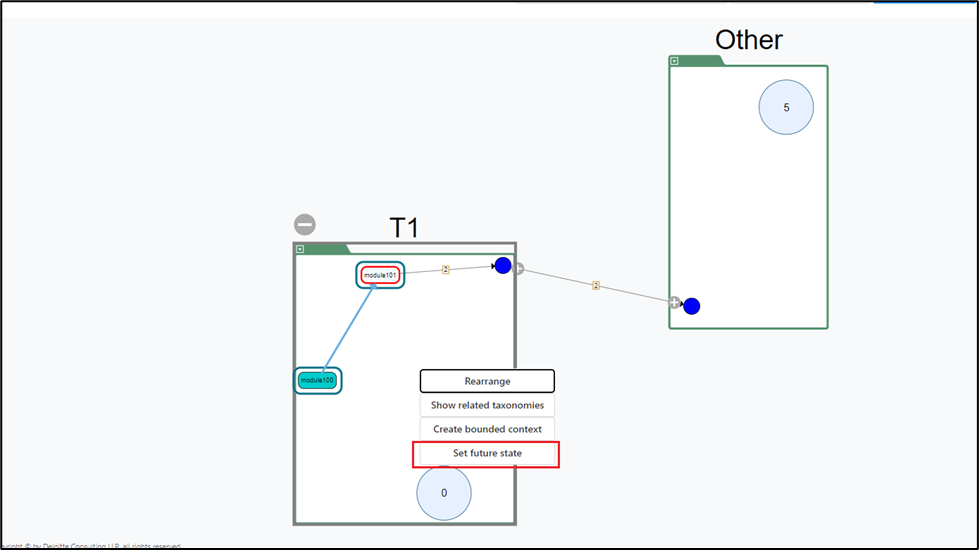
Right-click anywhere in the taxonomy and select Set future state from the context menu.
Step 2:
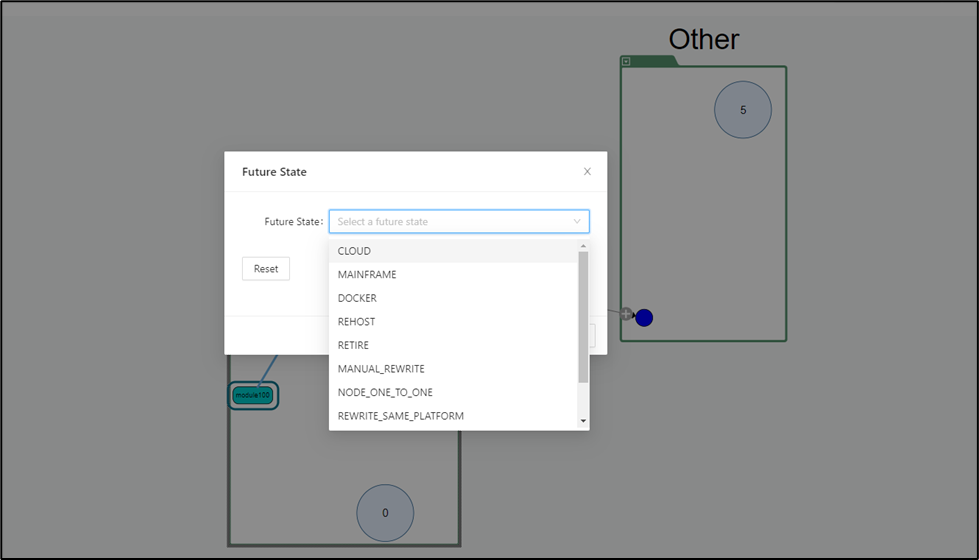
A pop-up window will appear. Select an appropriate option from the drop-down menu.
Step 3:
Click OK to confirm your changes.
After a few seconds, the future state is updated and the color of the taxonomy changes from the default green to the color for the option you selected.
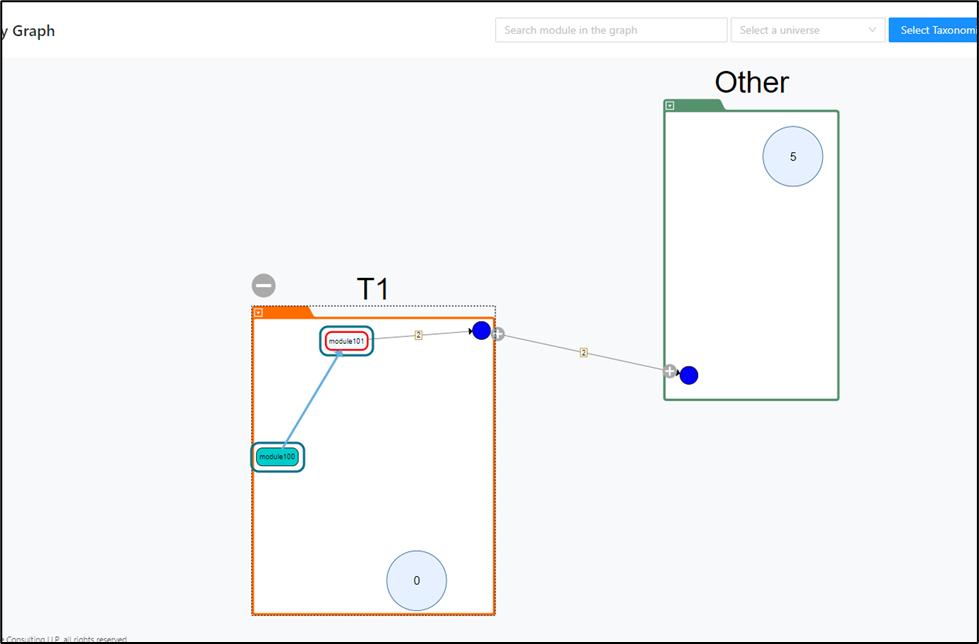
This indicates that the future state has been set. You can change it again whenever needed.
To reset the state to the previous default state, proceed as follows:
Step 1:
Right-click anywhere in the taxonomy and select the Set future state option from the context menu.
Step 2:
A pop-up window will appear. Click Reset and then OK to confirm the changes.
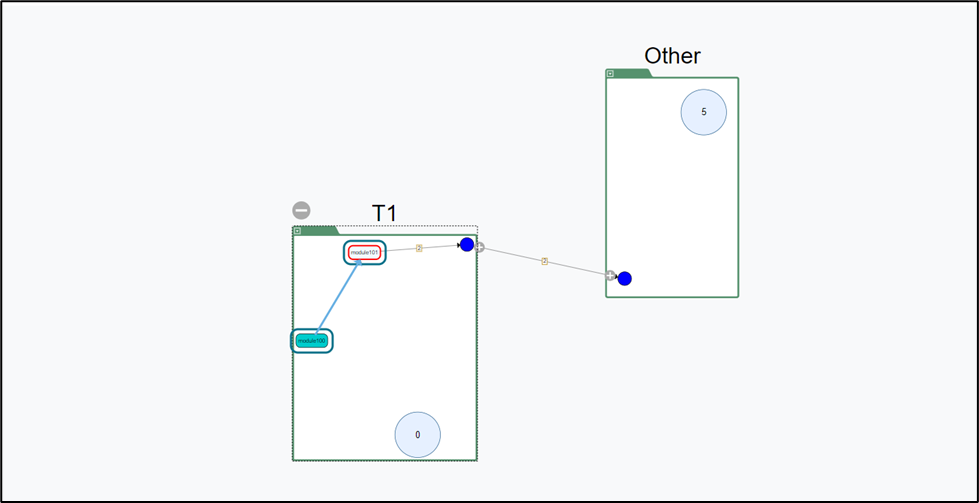
The future state is now updated to the default state.