Modules
Modules are generated during Discover Metrics (code base upload) to encapsulate discovered system artifacts, for example, source files, SQL scripts, etc., from the code base, along with any generated metadata such as annotations, dependencies, metrics, taxonomies, data dictionary entries, and descriptions, providing increased context on those system artifacts. Changes to Modules are updated from incremental Discover Metrics scans and will be reflected in the Mining Web UI.
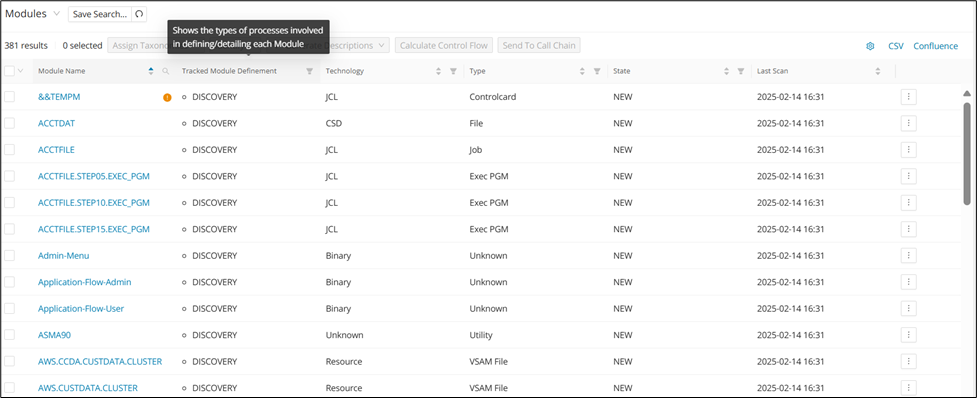
To open a list of all available modules, select Modules from the categories on the left. The page displays all discovered modules with their name, technology, type, and the last scan date for Discover Metrics. The number of results is displayed above the modules table, along with a button to export the table information in CSV format.
Info
The Modules menu item, as well as each affected module in the table, will be marked with an orange badge if they require review. Modules are marked for review if they contain metadata (for example, annotations, taxonomies, data dictionary entries, module descriptions) and changes to the module code are detected after incremental Discover Metrics scans.
Using the modules table
To narrow down results, you can search by Module Name. To do so, click the search icon in the Module Name column and enter a partial or full Module name, then click Search . To reset the search and display the full list of modules, click the search icon again and click Reset .

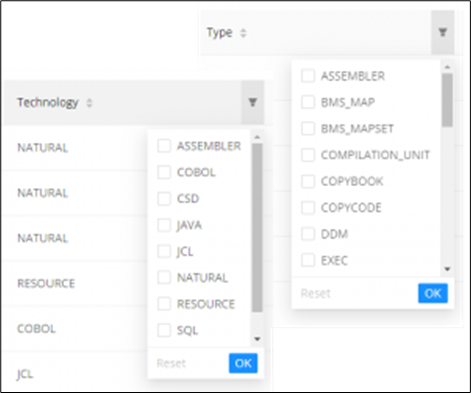
To filter columns, for example, by Technology or Type, click the corresponding filter icon and select the appropriate entries from the drop-down lists. You can select multiple values for each filter.
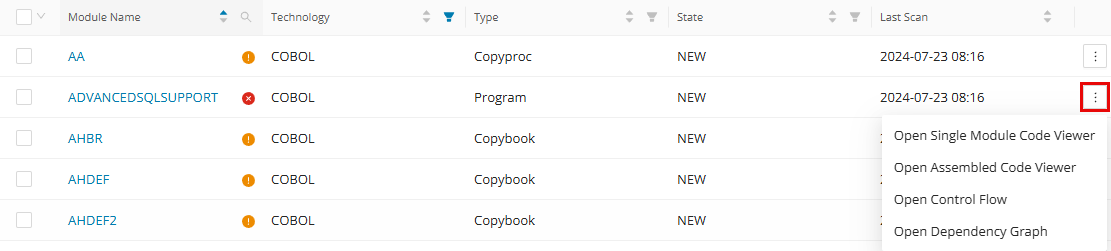
To directly access a module in Code Viewer or open its Control Flow or Dependency Graph, select the corresponding link in the shortcut menu, designated by the three dots on the rightmost column.
It is also possible to filter columns with the filter option "None" to get a result in which entities (modules, annotations, data dictionary) don't have a value assigned to a certain data point.
Once the desired modules are displayed, you can export the list by clicking CSV in the top right corner.
Feature overview
The Modules area combines bulk toolbar actions with module-level investigation and editing workflows. Use the following overview to jump directly to the corresponding feature page.
| Feature | Description |
|---|---|
| Assign Taxonomies | Assign technical and business taxonomies from the modules table, including Taxonomy Propagation to extend selected taxonomy assignments across related dependencies. |
| Identify | Run bulk identification workflows from the modules table, including candidate identification, dead-code analysis, technical taxonomy assignment, module descriptions, functional blocks, and process sequencing. |
| Generate Descriptions | Generate GenAI-assisted annotation, module, and Data Dictionary descriptions from the modules table, with options to add context and improve output quality. |
| Calculate Control Flow | Pre-calculate control flow graphs for selected modules so the Control Flow Graph loads faster later from Module Details. |
| Calculate Data Lineage | Pre-calculate data lineage for selected modules and fields so lineage views open faster when needed. |
| Send to Call Chain | Send selected modules directly to the Call Chain workflow so you can visualize inbound and outbound connectivity without rebuilding the selection manually. |
| Code Viewer | Investigate individual modules in detail, review metadata and relationships, and perform module-level editing workflows from the code-centric analysis view. |
| Module Details | Open the detailed module page to review metadata, metrics, dependencies, and generated artifacts tied to a specific module. |