Dashboard
After logging into the Mining Web UI and selecting a Client and Project, you will be led to the Dashboard page by default. The Dashboard is the default view of the Mining Web UI, and it provides spotlight overviews from the Code Discovery, including the number of missing source files and modules containing parser errors. Also, when conducting product demos, you can configure the "Showcase" mode on the View tab of the Configuration page, which will disable the display and red highlighting of parser errors on the Modules tile at the top of the page.
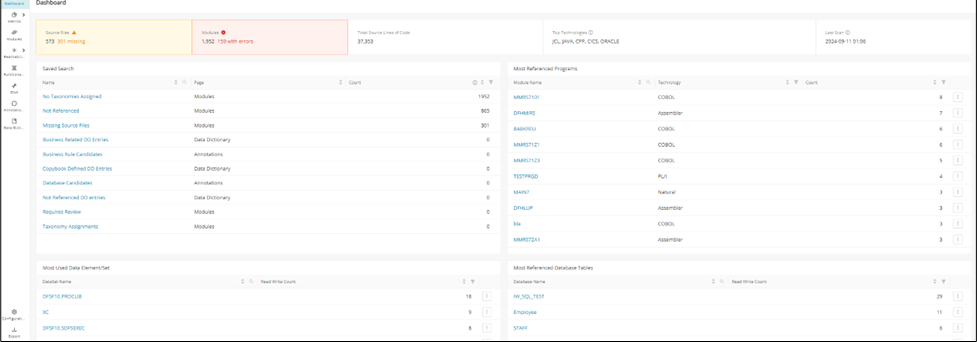
The Dashboard features a panel on the top, listing the number of Modules and Total Source Lines of Code, the Top Technologies, and the Last Scan date for Discover Metrics.
Additionally, information cards for the following categories are displayed:
| Category | Available Filters | Data Provided By |
|---|---|---|
| All Business Taxonomies | --- | Taxonomies, Identify Technical Taxonomies |
| All Taxonomies | --- | Taxonomies, Identify Technical Taxonomies |
| Saved Search | Name, Count | Discover Metric, Identify Candidates, Annotation |
| Most Referenced Programs | Module Name, Language, Value | Discover Metrics |
| COBOL Programs with Most File Descriptors (File In/Out) | Module Name, Language, Type, Value | Discover Metrics and Calculate Control Flow |
| Most Used Data Element/Set | DataSet Name, Read Write Count | Discover Metrics |
| Programs with Most Candidate Business Rules | Module Name, Language, Type, Value | Identify Candidates |
| Most Referenced Database Tables | Database Name, Read Write Count | Discover Metrics |
| Most referenced IMS Databases | Database Name, Read Write Count | Discover Metrics |
Info
If no data is available for the respective card, for example, if Discover Metrics has not been executed, the related cards above will be hidden from view.